Big Picture Synopsis
Stocks:
Stable VIX Pattern
Short Term Neutral
Intermediate and Long Term: Bullish
Bonds:
Short Term: Neutral
Intermediate Term: Slightly Bearish
Long Term: Extremely Bearish
The investment strategy team at Goldman Sachs is predicting a 6% return in the S & P 500 this year and a 6% annualized return over the next five years. Barrons.com How many of these overpaid Wall Street hotshots have proved their ability to predict much of anything?
Personally, I would be pleased with 30% this year, followed by four years of a zero increase. I could then use 2014-2017 as vacation time from the stock market after taking some profits.
In the first installment of Barron's 2013 Roundtable (subscription required), Abby Cohen and Gabelli mentioned one of my favorite statistics to support her positive views, the DSR ratio, though they did not use that acronym. Cohen stated that "monthly debt payments relative to income are at the lowest level since the 1990s". Gabelli noted that "consumer wealth is at a record level and consumer debt is falling".
Cohen also mentioned that the FED model for valuing the market, which compares the stock market's earnings yield with the long treasury yield, suggests year end fair value for the S & P 500 at 1750.
The WSJ published earlier this week the DJIA returns during each President's term starting with William McKinley in 1897. The DJIA returned 71.71% in Obama's first term and 111% in Clinton's first term. The S & P 500 rose 85% during Obama's first four years as President.
**********
Ten Year Treasury Mispricing
The break-even yield for the ten year TIP, the market's future inflation estimate, is hovering around 2.5%
Break-Even Calculation:
Take the 10 Year TIP Yield
Daily Treasury Real Yield Curve Rates
And Add the 10 Year Nominal Yield:
Daily Treasury Yield Curve Rates
=Break-Even, the level of inflation at which investments in both instruments will be the same.
TIPS Liquidity, Breakeven Inflation, and Inflation Expectations (2011-19, 6/20/2011)
1/22/2013
Ten Year TIP -.68
Ten Year Nominal= 1.86%
Break-Even=2.54% Estimate Annualized Inflation for the next 10 years
The ten year nominal treasury rate is forecasted by the market to produce an annualized negative real rate of return of close to .6%. How is that rational?
My theory is that the FED can not influence the break-even spread, but it has warped the free market in the nominal 10 year yield through its bond buying program. What would be the ten year treasury yield now in a free market where the Fed is not buying anyting? 3.5%? 4%? If the market believe that the FED has ended its QE programs permanently, I suspect that the 10 year would float up to a 3.5% yield within one year thereafter based on the market's current 10 inflation forecasts.
If the 10 year treasury nominal yield is off, then other rates that trade at spreads to treasury yields would likewise be off.
Junk bonds are selling at what I would call scary yields now given their risk. For the first time ever, the Merrill Lynch High Yield bond index fell recently below a 6% yield: BofA Merrill Lynch US High Yield Master II Effective Yield
And, for the first time, the junk bond yield minus the earnings yield on the S & P 500 (trailing 12 months) is below zero. Chart- Business Insider Think about that for a second.
*********
CPI
The Labor Department reported that inflation was unchanged in December on a seasonally adjusted basis. CPI rose 1.7% Y-O-Y without seasonal adjustment.
I am still waiting for evidence of Zimbabwe like inflation in the U.S. predicted by Peter Schiff and Marc Faber back in 2009 while appearing on the Glen Beck show. Of course, Schiff will simply say that the civil servants working in the U.S. government, who compile the numbers, are engaging in some kind of massive conspiracy to hide the true state of affairs. Schiff is of course engaged in self promotion for profit, just another person who has found a highly profitable niche appealing to a fringe element of investors by constantly predicting financial Armageddon around the corner (e.g. Harry Dent).
*********
Mortgage Applications and New Home Construction:
The Mortgage Banker's Association reported a 15.2% jump in mortgage applications for the week ending 1/11/13, compared to the prior week. The refinancing share of those applications remained unchanged at 82%. The average rate for 30 year FHA backed loans was reported at 3.39%. Mortgage Applications Increase in Latest MBA Weekly Survey
Last Thursday, the government reported a surge in new home construction. census.gov/construction .pdf; WSJ
**************
More Thoughts on Stock Cycles:
More Thoughts on Stock Cycles:
The S & P 500 has had an incredible run off the March 9, 2009 low of 676.53. On the next day, the index rose 43.07 points, or 6.36%, to close at 719.6. S & P 500 Historical Prices I am using March 10, 2009 as the probable start date of a new long term secular bull market in stocks. I would have used the word "possible" for the first two or three years.
In the first two or three years after the snapback rally from a catastrophic stock market decline starts, it is not relevant whether I characterize the rally as a cyclical bull market in a long term secular bear market or the start of a long term secular bull market. Either way, the investor needs to play the rally. Snapbacks from the catastrophic phase of a long term bear market are the norm.
Every long term secular bull market starts its life looking like that cyclical bull rally in the long term secular bear market. So, it is hard to know in real time whether the rally is one or the other. Eventually, the investor has to fish or cut bait.
In every long term bear market, there are strong cyclical bull markets, particularly after the catastrophic phase of the secular bear market, defined to mean by me as a fairly quick decline of nearly 50% or more. No one would quibble with my use of the term "catastrophic" in that context.
Generally, the snap back rally from the catastrophic decline will be extremely powerful and will generally be among the to ten largest percentage gains in stock market history.
Some of the gains in the Great Depression are still among the largest on record. The catastrophic phase of that long term secular bear market occurred at the start-between October 1929 to 1933. The S & P index declined 86.2% before hitting bottom in 1932.
This is a link to a DJIA chart that shows a bottom of 41.22 in 1932 following by a huge snap back rally that took the average up to 194.4 by early 1937, when the government's stimulus policies were withdrawn. StockCharts.com For someone buying their first stock in 1932, that was a generational opportunity, though not so good for an early 1929 buyer on 90% margin.
Looking back, it was clear that the rally starting in 1933 was simply a countervailing snapback rally off lows reached during the crash period. Still, the rally needed to be played irrespective of its classification.
Sooner or later, however, a decision needs to be made on whether the long term bull market has started or whether the cyclical bull is running out of steam with the long term bear market about to assert its nasty power once again. Does the investor sell the rip after two, three or four years? Or, go into buying the dips and a long term holding mode, the more appropriate strategy for long term secular bull markets with nips and tucks here and there along the way?
Sooner or later, however, a decision needs to be made on whether the long term bull market has started or whether the cyclical bull is running out of steam with the long term bear market about to assert its nasty power once again. Does the investor sell the rip after two, three or four years? Or, go into buying the dips and a long term holding mode, the more appropriate strategy for long term secular bull markets with nips and tucks here and there along the way?
I ask myself whether the problems underlying the long term bear have been largely resolved and whether there are in place drivers for the next long term bull. That sounds like a simple inquiry. In 1982, I stated to myself that the Federal Reserve had squashed inflation which was the underlying cause of a long term bear market in both stocks and bonds. That one was easy. Clear as a bell. The current problem is more murky.
I started to address those same issues in 2009, and there are a large number of posts on this subject. Some of those posts refer to years like 1974, a catastrophic phase of a long bear market which was followed by a powerful two year snapback rally. The bear market continued for another six years after that snapback rally ran its course.
Stocks, Bonds & Politics: 1974 or 1982: Start of Cyclical Bull in a Long Term Secular Bear Market or the Start of Secular Bull Market? (September 2009)
More on 1982 or 1974 (September 2009)
Continued Discussion on 1982 or 1974 (June 2010)
Stocks, Bonds & Politics: The Big Picture Questions (August 2011)
In those posts, I identify the driver for the next bull market as the powerful demand forces growing by leaps and bounds throughout the developing world. It would not be fair to characterize many of those markets as "emerging" anymore but simply as the "growth markets". China will after all likely surpass the U.S. in GDP growth by 2030, probably a few years sooner.
The underlying problem was too much debt among consumers and their governments in a few developed countries, including the U.S. and several European countries. Resolution of those myriad problems is harder to track than the central bank's successful campaign against inflation.
The U.S. consumers in aggregate have successfully deleveraged, as shown in the Federal Reserve's DSR and FOR ratios. Household Debt Service and Financial Obligations Ratios Those ratios show that consumers in aggregate now have more money to save and/or to spend due to their debt service obligations returning to pre Age of Leverage levels, which I define as roughly starting in 1985 when both the U.S. government and the American public went into increasing stages of debt insanity.
Of course, a large segment of the population needs to perform more work to reduce their debt loads. The deleveraging is continuing at a rapid pace as more homeowners, including those under water, refinance their mortgages at the current abnormally low rates. Many are doing so under the government's HARP program.
And, I do know some citizens who are going from no mortgage debt and a zero DSR ratio to a much higher DSR simply because they can borrow money on their homes at less than 3% for 15 years. I have been tempted myself, but why bother.
The U.S. government is making far slower progress in addressing its debt and budget problems. Maybe the government will be bailed out by some spending restraints and higher taxes already implemented as part of the fiscal cliff deal, plus about eight years or so of decent GDP growth.
Still, I believe that the market is sensing that most of the serious problems have either been solved or are close to resolution, and the remaining problems will no longer be an impediment to above average worldwide GDP growth fueled by the "growth markets" with help from the rejuvenated American consumer and consumers and governments in more responsible developed nations (e.g. Canada, Australia, Germany, Netherlands, and Singapore)
The long term bull market that started in 1982 had an enormous run before hitting a roadblock in 1987. The first leg topped out after five years. That move started on August 13, 1982 with a close at 102.42. By 8/31/1982, the S & P 500 index had risen 14.87%. The move had barely begun. Historical Prices
The first leg expired at 336.77 on August 25, 1987 Historical Prices The market had just gone too far, too fast, and prices were subsequently reset in the weeks thereafter culminating with the 1019/1987 plunge to 224.83. Historical Prices I would call that reset a somewhat scarier than normal reset within the context of an ongoing long term dominant secular bull market.
The S & P 500 recovered its August 1987 price by August 1989: Historical Prices After some understandable action during the 1990-1991 recessionary period, the next leg started in 1991 from around the August 1987 levels that took the S & P 500 up to an October 1997 high of 983.12.
I break this prior long term secular bull market down as follows:
First Leg-5 years
Reset-Digestion-Recovery: 4 years
Second Leg-7 years
Overall ANNUALIZED return in the S & P 500 adjusted for inflation with dividend reinvested: 14+%
Annualized Returns of the S&P 500
To achieve that 14% return, an investor could not be sitting out the first leg or the second leg.
Annualized Returns of the S&P 500
To achieve that 14% return, an investor could not be sitting out the first leg or the second leg.
For now, I am calling the market's action since 3/9/2009 as the first leg of a long term secular bull market. If that proves to be the case, it will be the first one to start at the end of a catastrophic decline. I will be using the VIX Asset Allocation Model to reduce my stock allocation after a Trigger Event.
The 1/1/49 to 1/1/66 long term secular stock bull market had less drama, with relatively minor and shorter pullbacks:
First Leg 1/1/49 to 7/30/56
Digestion 8/1/56 to 10/1958
Second Leg: 10/58 to 12/31/1961
Digestion and Recovery 1/1/62-8/1963
Last Leg: 8/1963 to 1/1/66
S&P 500 Index Chart
Total Gain Adjusted for Inflation and Reinvestment of Dividends: 14.4% Annualized
Annualized Returns of the S&P 500
I foresee a significant possibility of a stock market bubble forming within the next one to three years based primarily on the monetary policies of the Fed and other central banks. The Fed is forcing investors into risk assets by turning cash into trash and creating artificial negative real rates of return on higher quality bonds. This could create a stampede into stocks driving prices into an unsustainable parabolic pattern within the next 1 to 3 years.
1. Bought 100 ARR at $6.86 and 100 BKCC at Roth IRA at $10.38 (see Disclaimer):

Security Descriptions: Armour Residential REIT (ARR) is a Mortgage REIT.
BlackRock Kelso Capital (BKCC) is a business development corporation (BDC).
Both REITs and BDCs can avoid taxation at the corporate levels for income distributed to their shareholders. This will generally result in greater dividend yields, compared to regular "C" corporations. The downside is that BDCs and REITs lose their capital cushion for rainy days and to grow the business organically with that capital.
Prior Trades: None for BKCC.
I discussed the purchase of 150 ARR in a recent post. Item # 1 Bought 150 ARR at $7.46 (10/11/13). I have nothing to add to that discussion other than the following. The company did announce in December an authorization to buy up to $100 million in stock. And, my last purchase at $6.86 was 8% below the prior one. The decline was -4.6% adjusted for dividend payments made after the last purchase. Lastly, ARR subsequently reduced the monthly dividend from 9 cents per share to 8 cents. Mortgage REITs have been reducing their payouts due to margin compression largely due to prepayments on higher yielding securities.
I also own 50 of ARRPRA. Bought 50 ARRPRA at $25.50
ARR News Releases: Home - ARMOUR Residential REIT, Inc.
Last Earnings Report for BKCC: For the Q/E 9/30/12, the company reported net investment income of 32 cents per share and 30 cents on an adjusted basis. BKCC paid out 26 cents per share in dividends during the quarter.
This is how the company described the yields on its investments:
Form 10-Q; Press Release
Net asset value was reported at $9.55 per share as of 9/30/12.
A list of BKCC's investments can be found in last filed 10-Q starting at page 15: Form 10-Q
BlackRock Kelso Capital - Overview
Rationale: (1) Solely About the Tax Free Income Generation in the ROTH IRA. The general idea is to return 10% annually in the ROTH. If I can manage that return solely with the dividend, then it is only necessary to avoid losing money on the stock. My round trip commission for the 100 ARR will be $14, so I will simply need to wait until I can sell the 100 shares at over $7 after harvesting maybe a year or so of monthly dividends payments.
Last year, I had a 10.7% return in the Roth IRA with almost no individual stocks, other than a few REITs and BDCs, and over $20,000 in cash earning nothing for most of the year.
Risks: (1) A Common Downside for both REITs and BDCs Is the Flip Side to their Benefit of High Dividends: Almost all of the income is being paid out to the common shareholders. While that produces a higher than normal dividend, the downside is that the capital is no longer available to weather business cycle downturns and to grow the business organically. The need for capital is often met, particularly by BDCs, by a constant stream of share issuances. In the past several years, many of those issuances by BDCs have been been blow book value per share. So, there is clearly a price paid for the high yields.
Unlike PSEC and some other BDCs which are serial issuers of common stock I did not find any recent stock issuance by BKCC which is a positive from my perspective. I did note a January 2011 sale of $158M in a senior secured note maturing in January 2016 with a 6.5% coupon. I may have missed it, but the last share issuance appears to be in October 2010, when the company sold shares at $11.95. BlackRock Kelso Capital - Press Releases
(2) Net Interest Margin Compression for Mortgage REITs Due Primarily Refinancing Risks: The current operating environment is far from optimal. Mortgage REITs have already received the benefits of low borrowing costs. Many of the securities bought with those borrowed funds are being redeemed due to prepayments. The reinvestment of those proceeds will be in lower yielding mortgage securities, resulting in a compression of the net interest margin and lower income for the REIT.
(3) Leverage Particularly for Mortgage REITs: Borrowing boatloads of short term money to buy longer term securities is inherently risky. As long as short term borrowing costs remain low, the Mortgage REITs should be able to earn something on the spread, though there are still a number of ways the REIT could lose money such as a decline in value of the mortgage securities and/or hedges going the wrong way.
(4) For BDCs, their loans are at high rates for a reason. They are loaning money to mostly private companies that would have trouble raising capital except at high rates from private equity. BKCC reported a net realized loss on its investments of $73.216+M for the first nine months of 2012, resulting primarily from two investments. (page 47 of 10-Q).
(5) Dividend Cuts: The last annual report for BKCC shows substantial dividend cuts. The quarterly rate was 43 cents per share in 2008, which was cut to 16 cents in 2009. (Form 10-K at page 42) Hopefully, that period will be known as the stock market equivalent of the 100 year flood.
See Annual Report Risk Sections:
2011 Annual Report for BKCC: Form 10-K
2011 Annual Report for ARR: armour_10-k
Future Buys: Not Likely for either one. I am extremely cautious in investing in both Mortgage REITs and BDCs.
Quote: BlackRock Kelso Capital (BKCC)
Quote: Armour Residential REIT (ARR)
Close on 1/22/13
ARR: 7.00 +0.08 (+1.16%)
I view BKCC as a marginal purchase.
BKCC: 10.52 +0.07 (+0.67%)
2. Bought 200 of the Stock CEF BIF at $6.67 (see Disclaimer):

Security Description:
This fund only provides weekly updates of net asset value per share.
Data as of Friday 1/11/13:
Net Asset Value Per Share=$8.67
Market Price: $6.69
Discount= -22.84%
Subsequent Data 1/18/13:
Net Asset Value Per Share=$8.75
Market Price=$6.84
Discount=21.83%
CEFA Page (shows total expense ratio at 2.84% with leverage and a 1.559% management fee)
This fund is heavily weighted in Berkshire Hathaway.
In 2012, the fund paid out $.29 per share in dividends and $.11 in 2011. This fund is not a big dividend yield vehicle, unless it changes course and decides to harvest more meaningfully some of its long term capital gains which I do not foresee happening. Many investors may like the long term holding of stocks like Berkshire.
BIF Page at Morningstar (rated 4 stars; three year average discount at 18.83%; light leverage use)
SEC Form N-Q for the period ending 8/31/12: Boulder Growth & Income Fund As of that date, Berkshire represented 26.3% of the fund's holding, probably more now due to BRK's appreciation since that date:
BRK-A Interactive Chart
BRK-B Interactive Chart
Last SEC Filed Shareholder Report for the period ending 5/31/12: Boulder Growth & Income Fund
Prior Trades: NONE. I have bought and sold 100 shares of the Boulder Total Return (BTF) back in 2010. I realized a gain of $175.07, see snapshot at Item # 2 Bought 200 FOFI at $6.77
Rationale: (1) Capital Appreciation with Very Modest Income Potential: I generally like the portfolio. The large Berkshire stake and the fund's discount to net asset value are also attractive to me.
Risks and Disadvantages: (1) The main disadvantage from my perspective is the expense ratio excluding the leverage costs.
Given the high concentration in Berkshire stock, that fact alone can add both risks and benefits.
This one may have a perception problem among investors as evidenced by its unusually high discount to net asset value. There may be several reasons for that abnormally high discount, some rational and others less than rational. The large discount may be due in part to the high expense ratio, the lack of meaningful dividend support due in large part to the lack of turnover, investor perceptions about the management company including those issues discussed in this Morningstar article about Boulder. So, this fund has some issues.
The remaining risks are typical for stock CEFs.
Quote: Boulder Growth & Income Fund (BIF)
Close on 1/22/13: BIF: 6.88 +0.04 (+0.58%)
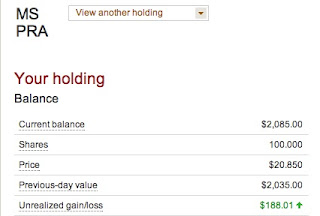
3. Pared 50 of 250 MSPRA at $20.8 (see Disclaimer): In a recent post, I discussed paring this position after I added MLPY, a senior unsecured note issued by Morgan Stanley. I was over my comfort level in total exposure to MS securities. Item # 3 Bought 50 MLPY at $15.35 MLPY is an ETN that tracks the Cushing MLP High Income Index.
Prior to this sale, I owned 150 shares of MSPRA in my main taxable account and another 100 in a satellite taxable account.
I took this snapshot of my 150 share position shortly before selling 50 shares:
As shown in that snapshot, the highest cost shares were sold using FIFO accounting. Those shares were purchased in December 2010. Bought 50 MSPRA at $19.71
I received a quarterly dividend payment of $38.33 on 1/15/13 for the 150 shares held in the taxable account:

In that account, my average cost per share prior to the sale was $18.78. The average cost for the remaining 100 shares in that account is $18.23. This is a standard trading technique that I use for a wide variety of securities, particularly those that experience severe bouts of volatility which is the case for equity preferred stocks in general.
In an August 2011 post, I noted a day when the pricing of these securities varied intra-day by extraordinary amounts. Item # 1 Fear and Enhanced Volatility in Certain Classes of Income Securities There were crushed during the Near Depression period.
Stocks, Bonds & Politics: Advantages and Disadvantages of Equity Preferred Floating Rate Securities
Security Description: Morgan Stanley Non-Cumulative Pfd Stock Series A (MS.PA) is a non-cumulative equity preferred stock that pays qualified dividends at the greater of 4% or .7% above the three month LIBOR rate on a $25 par value. Prospectus Every word in that description is important.
Since I have owned this security for several years, on and off, I can confirm that the dividends have been classified as qualified in my 1099s. QuantumOnline.com also show MSPRA as paying qualified dividends.
Prior Trades: I have harvested some small gains on this security already. The largest gains were in 2010:
Bought 100 MSPRA at 12.88 in May 2009-SOLD 100 MSPRA at 21.43; Bought 50 MSPRA at 15.7-Sold MSPRA at 18.50; Bought 50 MSPRA @ 19.57 in IRA-Sold 50 MSPRA at 21.03 in Roth IRA.
The remaining 100 shares bought in the main taxable account are discussed in these two posts: Added 50 MSPRA at 19.54 January 2011; Bought 50 MSPRA at $16.6 September 2011
The purchase of 100 shares in the satellite taxable account is discussed in this post from March 2012: Item # 3 Added 100 MSPRA at $18.9 (commission=$7).
Snapshot of Satellite Account Position as of 1/16/13:
Recent Earnings Release for MS: Morgan Stanley reported adjusted E.P.S. of 45 cents for the 2012 4th quarter, beating the consensus estimate of 27 cents. Morgan Stanley Reports Fourth Quarter and Full Year 2012
Rationale: (1) Almost Entirely Risk Reduction: Given what happened during the Near Depression, I am naturally circumspect about preferred stocks issued by investment banks. The Lehman equity preferred, LEHPRG, is of course worthless now. I am really not concerned about MS at the moment, but I will still keep my overall exposure to MS securities lower than KO for example.
(2) Harvesting a Gain After 2 Years of Dividend Payments and Lower My Average Cost Some for the Remaining Shares-Standard Operating Procedure Here at HQ
The shares did have a nice pop on the day of my sale:
1/16/13 Close: MS-PA: 20.85 +0.50 (+2.46%)
Future Buys: I am always interested in acquiring this security at a price below $20, provided there is no adverse credit developments at MS. I would have to liquidate 50 MLPY before or soon after acquiring another 50 of MSPRA, due to my maximum exposure limit to MS securities.
Quote: Morgan Stanley Non-Cumulative Pfd Stock Series A (MS.PA)
Close on 1/22/13: MS-PA: 21.03 +0.08 (+0.38%)
4. Bought 600 OPM: CA at $2.65 CADs-Toronto Exchange (See Disclaimer): This purchase was in part a response to this Seeking Alpha article on Sunopta, and the comments to that article involving Opta Minerals which is majority owned by Sunopta (STKL). I discussed Opta briefly when I purchased my latest Lottery Ticket in STKL. Lottery Ticket Buys: 30 SMS at $9.26, 50 STKL at $5.85 & 30 QLGC at $8.83
I used some of my existing CADs to pay for this purchase:
Security Description: Opta Minerals Inc. (OPM) is a micro cap stock traded on the Toronto exchange. At the $2.65 CAD price, the total market capitalization is approximately $48 M CADs. Sunopta, an organic food company, owns 66.2% of OPM's stock. Clearly, STKL has no business owning a stake in this company. It is a non-strategic asset.
Link to Opta Information at the Toronto Stock Exchange: Stock Market Quotes (p/b shown at 1.035) A ten year chart shows that this stock hit its peak at over $6 back in 2007.
According to a description provided by the company, Opta sources and distributes industrial minerals, "from traditional copper and coal blasting slag to patented silica-free abrasives, construction grade and golf course sand, water filtration media and jet cutting gamets". Opta Minerals Inc. - About Us Those products are used in a wide variety of industries: Opta Minerals Inc. - Industries We Serve (detailed description of product uses) Opta is an interesting little company that I would characterize as cyclical. For this investment to work, I would want to see an improving economy in both Canada and the U.S.
Last Earnings Report: The 212 third quarter report looked promising to me. Earnings increased to 1.45M or 8 cents per share, compared to 3 cents in the 2011 third quarter. Revenues increased 36.8%. Net income for nine months increased 38.8% to $4.282M from 3.086M. E.P.S. for the first nine months was 23 cents per share, up from 17 cents in the 2011 comparable period. optaminerals.com-press-release.pdf
The company has completed three small acquisitions. One recent one was WGI Heavy Metals for C$.6 per share in cash. WGI is primarily involved in the processing and sale of industrial abrasive minerals, and the sourcing and sale of ultra-high pressure waterjet cutting machine replacement parts and components. optaminerals.pdf
Another 2012 acquisition was Babco Industrial Corporation, located in Saskatchewan, an industrial processor and supplier of petroleum coke, synthetic slag, ladle sand and crushed graphite.
Back in 2011, Opta commenced a strategic review of its options, which could have included a potential sale of the company but suspended that process in December 2011: Press_Release .pdf When announcing that suspension, Opta also announced the acquisition of Inland RC, a manufacturer of pre-cast refractory shapes, injection lances and electric furnace deltas. I know zilch about those products and have no desire to learn more.
Rather than discussing the potential benefits of these acquisitions, I will simply refer anyone interested to the SeekingAlpha article on Sunopta that goes into more detail
Rationale (1) Solely the Potential for Capital Gains: Possible Sale and Turnaround Potential
Risks (1) Small Company With a Lot of Products Operating in Cyclical Businesses-Lots of Moving Parts Can Cause Things to Go Wrong Here or There
Quote: Opta Minerals-(TOR: OPM)
I would label this purchase as speculative. No shares were traded today.
5. Pared Trade: Bought 100 GSPRD at $21.177 and Sold 50 GSPRA at $21.73-In a Satellite Taxable Account (see Disclaimer):
RB noted that this was a Nerd Machine trade, picayune in the extreme, typical nickel and dime mind set of the Lame Brain LB that has cost Headknocker trillions over the years.
Since this post is already long enough, and frequent readers are already familiar with these securities, my discussion will be out of format and brief.
Both GSPRA and GSPRD are non-cumulative equity preferred stocks issued by Goldman Sachs with $25 par values. Both securities have the same risks and are in pari passu (equal in priority and rights). Both are senior to common stock only in the capital structure and junior to all bonds.
GSPRA pays the greater of 3.75% or .75% above the 3 month LIBOR: Prospectus
GSPRD pays the greater of 4% or .67% above the 3 month Libor: Prospectus
GSPRD has a higher current yield by approximately .4%. The higher yield is caused by both a .25% higher coupon and a lower cost per share. The GSPRD yield at a total cost of $21.18 is about 4.72%. The GSPRA yield at a total cost of $21.73 is about 4.31%.
The small difference in the LIBOR float of .08% can not make up the yield differential based on original cost, when and if the LIBOR float is activated by a rise in the 3 month LIBOR rate sufficient to trigger an increase in the respective coupons. So, LB concluded that GSPRD was being mispriced in relation to GSPRA. For as long as the respective minimum coupons remain operative, the yield advantage for GSPRD will remain at about .4% annualized.
Advantages and Disadvantages of Equity Preferred Floating Rate Securities
History of the 50 shares of GSPRA:
Bought 50 GSPRA at 20.86
I recently bought 50 GSPRD in the main taxable account: Bought 50 GSPRD at $20.6
Both of these stocks go ex dividend for their quarterly distributions on 1/23/13:
Goldman Sachs Group Inc. Dep. Shs Pfd. Series D (GS.PD)
Goldman Sachs Group Inc. Dep. Shs Pfd. Series A (GS.PA)
The disparity in current yield widened in today's trading (1/22/13):
GS-PA: 22.38 +0.58 (+2.66%)
GS-PD: 21.30 +0.09 (+0.42%)
*********
I had one other purchase that I will discuss in the next post, which plays into the emerging market super cycle theme.
Politics and Etc:
1. Republicans Opposed the Modest Tax Decrease Proposed by Kennedy: When republicans were actually concerned about the deficit, they actually opposed tax decreases. I was generally aware that President Kennedy proposed to cut the highest marginal rate from 91% to 70% and the bottom rate from 21% to 14%. Until I read Bruce Bartlett's column in the NYT, I did not realize that republicans and southern Democrats who are of course republicans now opposed that modest reduction since it would increase the budget deficit. In the House, 126 republicans voted against Kennedy's tax reduction proposal. (link to 1963 article in NYT)
The 1/1/49 to 1/1/66 long term secular stock bull market had less drama, with relatively minor and shorter pullbacks:
First Leg 1/1/49 to 7/30/56
Digestion 8/1/56 to 10/1958
Second Leg: 10/58 to 12/31/1961
Digestion and Recovery 1/1/62-8/1963
Last Leg: 8/1963 to 1/1/66
S&P 500 Index Chart
Total Gain Adjusted for Inflation and Reinvestment of Dividends: 14.4% Annualized
Annualized Returns of the S&P 500
I foresee a significant possibility of a stock market bubble forming within the next one to three years based primarily on the monetary policies of the Fed and other central banks. The Fed is forcing investors into risk assets by turning cash into trash and creating artificial negative real rates of return on higher quality bonds. This could create a stampede into stocks driving prices into an unsustainable parabolic pattern within the next 1 to 3 years.
1. Bought 100 ARR at $6.86 and 100 BKCC at Roth IRA at $10.38 (see Disclaimer):
Security Descriptions: Armour Residential REIT (ARR) is a Mortgage REIT.
BlackRock Kelso Capital (BKCC) is a business development corporation (BDC).
Both REITs and BDCs can avoid taxation at the corporate levels for income distributed to their shareholders. This will generally result in greater dividend yields, compared to regular "C" corporations. The downside is that BDCs and REITs lose their capital cushion for rainy days and to grow the business organically with that capital.
Prior Trades: None for BKCC.
I discussed the purchase of 150 ARR in a recent post. Item # 1 Bought 150 ARR at $7.46 (10/11/13). I have nothing to add to that discussion other than the following. The company did announce in December an authorization to buy up to $100 million in stock. And, my last purchase at $6.86 was 8% below the prior one. The decline was -4.6% adjusted for dividend payments made after the last purchase. Lastly, ARR subsequently reduced the monthly dividend from 9 cents per share to 8 cents. Mortgage REITs have been reducing their payouts due to margin compression largely due to prepayments on higher yielding securities.
I also own 50 of ARRPRA. Bought 50 ARRPRA at $25.50
ARR News Releases: Home - ARMOUR Residential REIT, Inc.
Last Earnings Report for BKCC: For the Q/E 9/30/12, the company reported net investment income of 32 cents per share and 30 cents on an adjusted basis. BKCC paid out 26 cents per share in dividends during the quarter.
This is how the company described the yields on its investments:
 |
| 10-Q at page 44 |
Net asset value was reported at $9.55 per share as of 9/30/12.
A list of BKCC's investments can be found in last filed 10-Q starting at page 15: Form 10-Q
BlackRock Kelso Capital - Overview
Rationale: (1) Solely About the Tax Free Income Generation in the ROTH IRA. The general idea is to return 10% annually in the ROTH. If I can manage that return solely with the dividend, then it is only necessary to avoid losing money on the stock. My round trip commission for the 100 ARR will be $14, so I will simply need to wait until I can sell the 100 shares at over $7 after harvesting maybe a year or so of monthly dividends payments.
Last year, I had a 10.7% return in the Roth IRA with almost no individual stocks, other than a few REITs and BDCs, and over $20,000 in cash earning nothing for most of the year.
Risks: (1) A Common Downside for both REITs and BDCs Is the Flip Side to their Benefit of High Dividends: Almost all of the income is being paid out to the common shareholders. While that produces a higher than normal dividend, the downside is that the capital is no longer available to weather business cycle downturns and to grow the business organically. The need for capital is often met, particularly by BDCs, by a constant stream of share issuances. In the past several years, many of those issuances by BDCs have been been blow book value per share. So, there is clearly a price paid for the high yields.
Unlike PSEC and some other BDCs which are serial issuers of common stock I did not find any recent stock issuance by BKCC which is a positive from my perspective. I did note a January 2011 sale of $158M in a senior secured note maturing in January 2016 with a 6.5% coupon. I may have missed it, but the last share issuance appears to be in October 2010, when the company sold shares at $11.95. BlackRock Kelso Capital - Press Releases
(2) Net Interest Margin Compression for Mortgage REITs Due Primarily Refinancing Risks: The current operating environment is far from optimal. Mortgage REITs have already received the benefits of low borrowing costs. Many of the securities bought with those borrowed funds are being redeemed due to prepayments. The reinvestment of those proceeds will be in lower yielding mortgage securities, resulting in a compression of the net interest margin and lower income for the REIT.
(3) Leverage Particularly for Mortgage REITs: Borrowing boatloads of short term money to buy longer term securities is inherently risky. As long as short term borrowing costs remain low, the Mortgage REITs should be able to earn something on the spread, though there are still a number of ways the REIT could lose money such as a decline in value of the mortgage securities and/or hedges going the wrong way.
(4) For BDCs, their loans are at high rates for a reason. They are loaning money to mostly private companies that would have trouble raising capital except at high rates from private equity. BKCC reported a net realized loss on its investments of $73.216+M for the first nine months of 2012, resulting primarily from two investments. (page 47 of 10-Q).
(5) Dividend Cuts: The last annual report for BKCC shows substantial dividend cuts. The quarterly rate was 43 cents per share in 2008, which was cut to 16 cents in 2009. (Form 10-K at page 42) Hopefully, that period will be known as the stock market equivalent of the 100 year flood.
See Annual Report Risk Sections:
2011 Annual Report for BKCC: Form 10-K
2011 Annual Report for ARR: armour_10-k
Future Buys: Not Likely for either one. I am extremely cautious in investing in both Mortgage REITs and BDCs.
Quote: BlackRock Kelso Capital (BKCC)
Quote: Armour Residential REIT (ARR)
Close on 1/22/13
ARR: 7.00 +0.08 (+1.16%)
I view BKCC as a marginal purchase.
BKCC: 10.52 +0.07 (+0.67%)
2. Bought 200 of the Stock CEF BIF at $6.67 (see Disclaimer):

Security Description:
This fund only provides weekly updates of net asset value per share.
Data as of Friday 1/11/13:
Net Asset Value Per Share=$8.67
Market Price: $6.69
Discount= -22.84%
Subsequent Data 1/18/13:
Net Asset Value Per Share=$8.75
Market Price=$6.84
Discount=21.83%
CEFA Page (shows total expense ratio at 2.84% with leverage and a 1.559% management fee)
This fund is heavily weighted in Berkshire Hathaway.
In 2012, the fund paid out $.29 per share in dividends and $.11 in 2011. This fund is not a big dividend yield vehicle, unless it changes course and decides to harvest more meaningfully some of its long term capital gains which I do not foresee happening. Many investors may like the long term holding of stocks like Berkshire.
BIF Page at Morningstar (rated 4 stars; three year average discount at 18.83%; light leverage use)
SEC Form N-Q for the period ending 8/31/12: Boulder Growth & Income Fund As of that date, Berkshire represented 26.3% of the fund's holding, probably more now due to BRK's appreciation since that date:
| BRK/A and BRK/B Holdings as of 8/3/12 |
BRK-A Interactive Chart
BRK-B Interactive Chart
Last SEC Filed Shareholder Report for the period ending 5/31/12: Boulder Growth & Income Fund
Prior Trades: NONE. I have bought and sold 100 shares of the Boulder Total Return (BTF) back in 2010. I realized a gain of $175.07, see snapshot at Item # 2 Bought 200 FOFI at $6.77
Rationale: (1) Capital Appreciation with Very Modest Income Potential: I generally like the portfolio. The large Berkshire stake and the fund's discount to net asset value are also attractive to me.
Risks and Disadvantages: (1) The main disadvantage from my perspective is the expense ratio excluding the leverage costs.
Given the high concentration in Berkshire stock, that fact alone can add both risks and benefits.
This one may have a perception problem among investors as evidenced by its unusually high discount to net asset value. There may be several reasons for that abnormally high discount, some rational and others less than rational. The large discount may be due in part to the high expense ratio, the lack of meaningful dividend support due in large part to the lack of turnover, investor perceptions about the management company including those issues discussed in this Morningstar article about Boulder. So, this fund has some issues.
The remaining risks are typical for stock CEFs.
Quote: Boulder Growth & Income Fund (BIF)
Close on 1/22/13: BIF: 6.88 +0.04 (+0.58%)
3. Pared 50 of 250 MSPRA at $20.8 (see Disclaimer): In a recent post, I discussed paring this position after I added MLPY, a senior unsecured note issued by Morgan Stanley. I was over my comfort level in total exposure to MS securities. Item # 3 Bought 50 MLPY at $15.35 MLPY is an ETN that tracks the Cushing MLP High Income Index.
Prior to this sale, I owned 150 shares of MSPRA in my main taxable account and another 100 in a satellite taxable account.
I took this snapshot of my 150 share position shortly before selling 50 shares:
| 150 MSPRA Snapshot Shortly Before Sale of 50 Shares |
| 2013 MSPRA 50 Shares $38.58 |
In that account, my average cost per share prior to the sale was $18.78. The average cost for the remaining 100 shares in that account is $18.23. This is a standard trading technique that I use for a wide variety of securities, particularly those that experience severe bouts of volatility which is the case for equity preferred stocks in general.
In an August 2011 post, I noted a day when the pricing of these securities varied intra-day by extraordinary amounts. Item # 1 Fear and Enhanced Volatility in Certain Classes of Income Securities There were crushed during the Near Depression period.
Stocks, Bonds & Politics: Advantages and Disadvantages of Equity Preferred Floating Rate Securities
Security Description: Morgan Stanley Non-Cumulative Pfd Stock Series A (MS.PA) is a non-cumulative equity preferred stock that pays qualified dividends at the greater of 4% or .7% above the three month LIBOR rate on a $25 par value. Prospectus Every word in that description is important.
Since I have owned this security for several years, on and off, I can confirm that the dividends have been classified as qualified in my 1099s. QuantumOnline.com also show MSPRA as paying qualified dividends.
Prior Trades: I have harvested some small gains on this security already. The largest gains were in 2010:
| MSPRA 100 and 50 Shares: Realized Total Gain +$962.87 |
Bought 100 MSPRA at 12.88 in May 2009-SOLD 100 MSPRA at 21.43; Bought 50 MSPRA at 15.7-Sold MSPRA at 18.50; Bought 50 MSPRA @ 19.57 in IRA-Sold 50 MSPRA at 21.03 in Roth IRA.
The remaining 100 shares bought in the main taxable account are discussed in these two posts: Added 50 MSPRA at 19.54 January 2011; Bought 50 MSPRA at $16.6 September 2011
The purchase of 100 shares in the satellite taxable account is discussed in this post from March 2012: Item # 3 Added 100 MSPRA at $18.9 (commission=$7).
Snapshot of Satellite Account Position as of 1/16/13:

Recent Earnings Release for MS: Morgan Stanley reported adjusted E.P.S. of 45 cents for the 2012 4th quarter, beating the consensus estimate of 27 cents. Morgan Stanley Reports Fourth Quarter and Full Year 2012
Rationale: (1) Almost Entirely Risk Reduction: Given what happened during the Near Depression, I am naturally circumspect about preferred stocks issued by investment banks. The Lehman equity preferred, LEHPRG, is of course worthless now. I am really not concerned about MS at the moment, but I will still keep my overall exposure to MS securities lower than KO for example.
(2) Harvesting a Gain After 2 Years of Dividend Payments and Lower My Average Cost Some for the Remaining Shares-Standard Operating Procedure Here at HQ
The shares did have a nice pop on the day of my sale:
1/16/13 Close: MS-PA: 20.85 +0.50 (+2.46%)
Future Buys: I am always interested in acquiring this security at a price below $20, provided there is no adverse credit developments at MS. I would have to liquidate 50 MLPY before or soon after acquiring another 50 of MSPRA, due to my maximum exposure limit to MS securities.
Quote: Morgan Stanley Non-Cumulative Pfd Stock Series A (MS.PA)
Close on 1/22/13: MS-PA: 21.03 +0.08 (+0.38%)
4. Bought 600 OPM: CA at $2.65 CADs-Toronto Exchange (See Disclaimer): This purchase was in part a response to this Seeking Alpha article on Sunopta, and the comments to that article involving Opta Minerals which is majority owned by Sunopta (STKL). I discussed Opta briefly when I purchased my latest Lottery Ticket in STKL. Lottery Ticket Buys: 30 SMS at $9.26, 50 STKL at $5.85 & 30 QLGC at $8.83
I used some of my existing CADs to pay for this purchase:
 |
| 2013 Bought 600 OPM:CA at $2.65 CADs |
Security Description: Opta Minerals Inc. (OPM) is a micro cap stock traded on the Toronto exchange. At the $2.65 CAD price, the total market capitalization is approximately $48 M CADs. Sunopta, an organic food company, owns 66.2% of OPM's stock. Clearly, STKL has no business owning a stake in this company. It is a non-strategic asset.
Link to Opta Information at the Toronto Stock Exchange: Stock Market Quotes (p/b shown at 1.035) A ten year chart shows that this stock hit its peak at over $6 back in 2007.
According to a description provided by the company, Opta sources and distributes industrial minerals, "from traditional copper and coal blasting slag to patented silica-free abrasives, construction grade and golf course sand, water filtration media and jet cutting gamets". Opta Minerals Inc. - About Us Those products are used in a wide variety of industries: Opta Minerals Inc. - Industries We Serve (detailed description of product uses) Opta is an interesting little company that I would characterize as cyclical. For this investment to work, I would want to see an improving economy in both Canada and the U.S.
Last Earnings Report: The 212 third quarter report looked promising to me. Earnings increased to 1.45M or 8 cents per share, compared to 3 cents in the 2011 third quarter. Revenues increased 36.8%. Net income for nine months increased 38.8% to $4.282M from 3.086M. E.P.S. for the first nine months was 23 cents per share, up from 17 cents in the 2011 comparable period. optaminerals.com-press-release.pdf
The company has completed three small acquisitions. One recent one was WGI Heavy Metals for C$.6 per share in cash. WGI is primarily involved in the processing and sale of industrial abrasive minerals, and the sourcing and sale of ultra-high pressure waterjet cutting machine replacement parts and components. optaminerals.pdf
Another 2012 acquisition was Babco Industrial Corporation, located in Saskatchewan, an industrial processor and supplier of petroleum coke, synthetic slag, ladle sand and crushed graphite.
Back in 2011, Opta commenced a strategic review of its options, which could have included a potential sale of the company but suspended that process in December 2011: Press_Release .pdf When announcing that suspension, Opta also announced the acquisition of Inland RC, a manufacturer of pre-cast refractory shapes, injection lances and electric furnace deltas. I know zilch about those products and have no desire to learn more.
Rather than discussing the potential benefits of these acquisitions, I will simply refer anyone interested to the SeekingAlpha article on Sunopta that goes into more detail
Rationale (1) Solely the Potential for Capital Gains: Possible Sale and Turnaround Potential
Risks (1) Small Company With a Lot of Products Operating in Cyclical Businesses-Lots of Moving Parts Can Cause Things to Go Wrong Here or There
Quote: Opta Minerals-(TOR: OPM)
I would label this purchase as speculative. No shares were traded today.
5. Pared Trade: Bought 100 GSPRD at $21.177 and Sold 50 GSPRA at $21.73-In a Satellite Taxable Account (see Disclaimer):
RB noted that this was a Nerd Machine trade, picayune in the extreme, typical nickel and dime mind set of the Lame Brain LB that has cost Headknocker trillions over the years.
 |
| Sold 50 GSPRA at $21.73 and Bought 100 GSPRD at $21.177 |
Since this post is already long enough, and frequent readers are already familiar with these securities, my discussion will be out of format and brief.
Both GSPRA and GSPRD are non-cumulative equity preferred stocks issued by Goldman Sachs with $25 par values. Both securities have the same risks and are in pari passu (equal in priority and rights). Both are senior to common stock only in the capital structure and junior to all bonds.
GSPRA pays the greater of 3.75% or .75% above the 3 month LIBOR: Prospectus
GSPRD pays the greater of 4% or .67% above the 3 month Libor: Prospectus
GSPRD has a higher current yield by approximately .4%. The higher yield is caused by both a .25% higher coupon and a lower cost per share. The GSPRD yield at a total cost of $21.18 is about 4.72%. The GSPRA yield at a total cost of $21.73 is about 4.31%.
The small difference in the LIBOR float of .08% can not make up the yield differential based on original cost, when and if the LIBOR float is activated by a rise in the 3 month LIBOR rate sufficient to trigger an increase in the respective coupons. So, LB concluded that GSPRD was being mispriced in relation to GSPRA. For as long as the respective minimum coupons remain operative, the yield advantage for GSPRD will remain at about .4% annualized.
Advantages and Disadvantages of Equity Preferred Floating Rate Securities
History of the 50 shares of GSPRA:
 |
| 50 GSPRA: History Since Purchase in July 2011 at $20.86 |
I recently bought 50 GSPRD in the main taxable account: Bought 50 GSPRD at $20.6
Both of these stocks go ex dividend for their quarterly distributions on 1/23/13:
Goldman Sachs Group Inc. Dep. Shs Pfd. Series D (GS.PD)
Goldman Sachs Group Inc. Dep. Shs Pfd. Series A (GS.PA)
The disparity in current yield widened in today's trading (1/22/13):
GS-PA: 22.38 +0.58 (+2.66%)
GS-PD: 21.30 +0.09 (+0.42%)
*********
I had one other purchase that I will discuss in the next post, which plays into the emerging market super cycle theme.
Politics and Etc:
1. Republicans Opposed the Modest Tax Decrease Proposed by Kennedy: When republicans were actually concerned about the deficit, they actually opposed tax decreases. I was generally aware that President Kennedy proposed to cut the highest marginal rate from 91% to 70% and the bottom rate from 21% to 14%. Until I read Bruce Bartlett's column in the NYT, I did not realize that republicans and southern Democrats who are of course republicans now opposed that modest reduction since it would increase the budget deficit. In the House, 126 republicans voted against Kennedy's tax reduction proposal. (link to 1963 article in NYT)

No comments:
Post a Comment