Economy:
This article summarizes a Markit PMI report which has been producing lower number than the ISM reports. Flash manufacturing PMI at 11-month high, while services PMI slips to 15-month low-MarketWatch;
Markit Economics- Flash U.S. Composite PMI Survey (services reported at 52.4, down from 54.5 in November)
Markit's Flash Eurozone Composite PMI for December was reported at 58, an 82 month high, with the services PMI hitting an 80 month high at 56.5.
+++++++
Portfolio Management:
As short term bonds and CDs mature now, I am looking to replace them with investment grade senior unsecured bonds maturing in 2018 and 2019. I am not not even looking for possible bond purchases outside of that time frame now.
An example involved reinvesting the proceeds received from a maturing Sherwin Williams 1.3% SU bond into a Sysco 1.9% SU bond maturing on 4/1/19. I received the proceeds last Friday and bought the SYY bond that same day:

I was able to buy the SYY bond at a total cost of 99.979 and had to pay $8.23 in accrued interest to the seller.
For this SYY and just continuing to use it as an example, I am assuming only the risk of lost opportunity, one component of interest rate risk. This component relates to losing the opportunity to earn a higher interest rate for the same or similar bond, maturing at about the same time, by simply waiting to reinvest the proceeds. That risk is mitigated by three factors:
(1) The SYY bonds matures in about 15 months and is consequently not likely to go up much in yield unless short term rates rise far faster and higher next year;
(2) There is a cost to waiting since I would earn currently about .75% in the Fidelity Government MM fund which was the source of payment; and
(3) I have a constant flow of maturities that mitigates even the risk of lost opportunity associated with short term securities. If short term interest rates continue to rise through next year and into 2019, I will be able to continually reinvest the proceeds into higher yielding securities with similar maturities or lengthen the maturity periods some to pick up even more yield.
The Sysco bond matures in April 2019 and I can easily hold to maturity. That eliminates for me the interest rate risk of being forced to sell the bond at a loss to pay expenses.
I am not concerned about credit risk for this bond. The bond is more liquid than a CD purchased maturing at about the same time. The YTM favors the SYY bond over CDs by about .2% after taking into account the brokerage commission paid to purchase the bond. CDs maturing close to this bond currently pay 1.7% or 1.75%, with the best deal being the 1.75% CD from Brookline that pays interest monthly:

The same bank is offering a 1.85% monthly interest payment CD maturing in June 2019. However, if the forecast is for steadily higher short term rates, I would go with the Wells Fargo 1.75% monthly interest payment CD maturing on 1/22/19 rather than those Brookline CDs if I had to buy one or the other. Generally, when building a ladder, I look at all three to see whether they fill gaps in my ladder which has multiple maturities most every week.
The interest rate spread between short and longer term maturities continues to contract. Central banks throughout the developed world are interfering with the market's setting of intermediate and longer term interest rates. If the FED continues to lift the FF rate while other CBs create negative nominal yields and negative real yields, then that contraction may continue into 2018 and result in a yield inversion.
Global Government Bonds - Markets Data Center (Germany's five year bond closed at a -.332% yield last Friday; the Swiss government bonds are in negative nominal yield territory out to about 15 years-Yield Curves)
While manipulation of interest rates by several important central banks is the primary cause of negative real yields, there are disinflationary forces at work that impact U.S. inflation and interest rates, including the following:
(1) migration of manufactured goods production to the lowest cost producers (globalization);
(2) some excess capacity;
(3) the transparency of price due to the Internet,
(4) increased automation that lowers cost of goods, and
(5) consumer demand crimped by too much debt and anemic wage growth.
I would now add to those forces the following:
(6) the cut in U.S. corporate tax rates which will generate more price wars.
Consequently, it is hard for me to foresee now a meaningful rise in long term rates happening soon. The FED is likely to push up yields slowly between 1 month and 5 years by continuing to increase the federal funds rate.
For several months now, I have concentrated my buying on both the short and long end of the curve.
The short end provides me with about two-thirds of the intermediate term YTM, while the long end provides me with more yield. I am playing the long end with Tennessee Municipal Bonds.
The short end is more heavily weighted than my municipal bond allocation by about 2 to 1.
I am defining short term bonds as covering maturities between the present to three years from whatever is the present time.
So three years from today would be December 18, 2020; and I have a $5k in principal amount maturing today in my Fidelity taxable account that will be reinvested in higher yielding short term securities:

The $3K Northpointe CD paid monthly interest and was a 3 month CD. The $2K Bank of China CD will pay interest at maturity and was a 2 month CD.
I still have an intermediate term fixed income allocation but it has been cut probably in half over the past several weeks. I am several weeks behind in discussing those trades.
+++
Market Commentary and Markets:
Final tax bill: effect on project finance market | Knowledge | Norton Rose Fulbright
Bitcoin Eclipses Tulip Mania as Bubble Talk Grows
These companies will take a huge profit hit from lower tax rates - MarketWatch (relates to deferred tax assets)
J.P. Morgan economist says Trump tax plan will create one-tenth the jobs Jamie Dimon says - MarketWatch
There will be job additions and wage increases directly attributable to the tax cuts, but the impact will be so small that reasonable arguments could attribute those increases to other factors unrelated to taxes, including a tightening labor market where wage increases are already at 2.5% annually without the tax cuts.
The wage growth tracker of the Atlanta FED calculated a 3.4% increase in median wage growth for the 3 months ending in October 2017. Wage Growth Tracker - Federal Reserve Bank of Atlanta That model attempts to remove the drag in wage growth resulting from higher paid workers retiring and being replaced by younger and lower paid workers. That estimate is down from 3.9% hit in November 2016, but has been trending up since the 2010 Spring.
I view the last minute expansion of the refundable child tax credit to be a positive for the U.S. economy. I am a believer in trickle up rather than trickle down. The wealthy receive benefits when the bottom three income quintiles have more money to spend.
++++++
Trump:
How Trump’s skepticism of U.S. intelligence on Russia left an election threat unchecked - Washington Post (Trump still rejects the evidence that Russia interfered in the U.S. election. "The result is without obvious parallel in U.S. history, a situation in which the personal insecurities of the president — and his refusal to accept what even many in his administration regard as objective reality — have impaired the government’s response to a national security threat. The repercussions radiate across the government.")
How Trump’s skepticism of U.S. intelligence on Russia left an election threat unchecked - Washington Post (Trump still rejects the evidence that Russia interfered in the U.S. election. "The result is without obvious parallel in U.S. history, a situation in which the personal insecurities of the president — and his refusal to accept what even many in his administration regard as objective reality — have impaired the government’s response to a national security threat. The repercussions radiate across the government.")
12/12: Majority Views Tax Bill as Adding Financial Injury… POTUS Favors Wealthy, Say Americans
National (US) Poll - December 13, 2017 - Support For GOP Tax Plan Could Hurt Candidates and 7 to 1 Say DACA Immigrants Should Stay | Quinnipiac University Connecticut
++++++
1. REGIONAL BANK BASKET STRATEGY GATEWAY POST:
A. Bought 30 BHB at $28.05 in Schwab Account (probable trade) and 25 in Fidelity account at $27.66-Long Term Holding:
I used commission free trades for both purchases.
Schwab:

Fidelity:

The shares rallied last Friday along with the entire banking sector as it became even more certain that corporate tax rates would be substantially reduced starting in 2018.
Closing Price 12/15/17: BHB $30.00 +$1.90 +6.76%: Bar Harbor Bankshares, Inc.
Conditions remain unfavorable for net interest margin expansion. Small banks like BHB will benefit by a reduction in their effective corporate tax rates and less regulation.
NIM may even contract as short term deposit costs rise while longer term rates remain stable or decline.
I now 250 shares in my Fidelity with an average cost per share of $17.79. As shown in the following snapshots, this 25 share purchase raised by average cost per share to $17.79 from from $16.69.


I have not been reinvesting the dividend, nor have I sold any shares in my Fidelity account.
My first purchase in my Fidelity account was a 50 share lot purchase at $32 (2/7/2012). Since then, there has been two 3 for 2 stock splits that resulted in that 50 share becoming 112.5 shares with an average cost per share of $13.4. BHB Split History
I am trading BHB in my Schwab account. I previously harvested a profit on a 100 share lot sold at $31.05:
I realized a gain of $936.96 on that trade.

I will flip this 30 share lot under the right circumstances while keeping the larger 250 share position. I may add 20 more shares in that account on a slide below $25.
The right circumstances would include still having commission free trades in that account that expire next August and over a $100 share profit-just more small ball.
Chart: The stock has been dead money for the past year: Bar Harbor Bankshares Interactive Chart One reason is the price got ahead of earnings growth with a move from less than $20 in January 2016 to $33 in March 2017.
BHB Effective Tax Rates: A reduction in the federal income tax rate to 21% will meaningufully benefit this bank.
2017 YTD and 2017 Third Quarter:

Page 57 2016 Annual Report 28.2% to 28.8% for 2014-16
 Last Earnings Report:


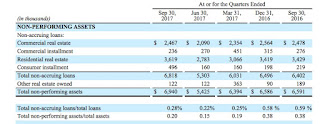
The efficiency ratio is good at 53.59% and is trending down. The NPL, NPA and charge off ratios are excellent at .28%, .2% and .1% respectively.
Note that BHB helpfully provides NIM numbers with and without purchased loan accretion. I would use the without numbers, calling it a core number since this accounting adjustment is temporary and will run off. The core NIM did expand to 2.93% from 2.84% in the 2017 third quarter. Operating conditions do not yet favor much, if any, growth in this important number. The lack of NIM expansion is still a major negative for regional banks.
There is no analyst coverage. If I simply annualized the $.57 in core E.P.S. from the third quarter, and made no adjustments to reflect a lower tax rate and any future growth in operating earnings, the annual EPS would be $2.28 and the P/E would then be 12.3 based on a total cost per share of $28.05.
Dividend Growth Rate 5 Years: 8.5%
Bar Harbor Bankshares 5-Year Dividend Growth Rate (BHB)
The current quarterly penny rate is $.1867 per share. Bar Harbor Bankshares Declares Quarterly Cash Dividend
I am not reinvesting the dividend, preferring instead to pick my spots for share purchases.
Recent Acquisition: Bar Harbor Bankshares and Lake Sunapee Bank Group Complete Merger
I owned shares of Lake Sunapee when BHB made the announcement about acquiring this bank which expanded BHB's operations into New Hampshire and Vermont. I mentioned at the time that I viewed this acquisition as a positive for BHB shareholders.
The Lake Sunapee Bank still has the same name: Locations-Lake Sunapee Bank Bar Harbor Bank & Trust has 14 branches in Maine: Locations -Bar Harbor Bank & Trust
Results During the Last Recession-A Category 4 Hurricane for Banks:
I view it as important to look at financial results during the last recession. How did the bank weather the Near Depression storm? Given the severity of that event on bank earnings, I view a non-performing loan to total loan ratio of less than 2% and a charge off ratio of less than .5% as excellent during that period:

I also like to compare 2007 with 2008 so the 2012 annual report will have both of those years.
Remaining profitable and maintaining the dividend during recessions are also important. BHB increased the dividend as shown above.
Page 38 2012 Annual Report-SEC Form 10-K Unadjusted for Future Stock Splits
Visa Stock: BHB, like other banks, were issued Visa Class B, which can be converted into Class A shares, in connection with Visa's Reorganization and IPO in 2008. However, the shares can not be converted until certain litigation is settled and that does not appear likely anytime soon.
BHB Discussion:

Based on the current conversion rate, which may change as outlined above, BHB would be entitled to receive 19,158 Visa Class A shares upon settlement of what VISA calls the "covered litigation". This subject is way beyond what I will discuss in any detail. For anyone interested, more information can be found in VISA's SEC Filings (e.g. Annual Report for the F/Y Ending 9/30/17 at pages 70-72, 105-108) ("Payments totaling $528 million were made from fiscal 2014 through 2017 from the U.S. litigation escrow account reflecting settlements with a number of individual merchants that had opted out of the class settlement, resulting in an accrued balance of $978 million related to U.S. covered litigation as of September 30, 2017.") A class action settlement was thrown out by the Second Circuit Court of Appeals last year. Visa, MasterCard $7.25 billion settlement with retailers is thrown out: Reuters Visa has settled with some merchants that have opted out of the class actions as noted in the Annual Report linked above. This litigation may not end in my lifetime. I am confident, however, that the lawsuits are affording richly paid employment to a small army of lawyers.
VISA Inc. Cl A Stock Quote
2. Intermediate Term Bond/CD Ladder Basket Strategy:
A. Bought 2 Murfreesboro Tennessee 2% Water and Sewer Bonds Maturing on 6/1/2026:

EMMA Page
Murfreesboro - Google Maps (county seat of Rutherford County Tennessee and located 34 miles from Nashville)
Middle Tennessee State University, which has over 22K students, is located in Murfreesboro
Besides the tax free income generation and credit quality, I also bought this bond for its 2026 maturity.
Credit Rating: Aa1 by Moody's
Bought at a Total Cost of 97
YTM Then at 2.392%
Current yield at 2.062%
The Vanguard price was .2 higher for the same lot than Fidelity, and Vanguard charged $5 more than Fidelity in a commission. In other words, the seller's limit price was at 99.6 at Fidelity which would have given me a total cost per bond of 99.7. Vanguard marked the seller's limit price up to 99.8, possibly to pay an intermediary, and my total cost with that firm's commission was consequently at 97. I bought the bond in my Vanguard Taxable account since I had an excess amount of cash parked in my Vanguard Federal MM fund, that broker's settlement fund, that was paying 1.06% as of 11/28, which is taxable.
Optional Redemption: At par value on or after 6/1/23
Security:

Tax Matters: Federally Tax Free
1. REGIONAL BANK BASKET STRATEGY GATEWAY POST:
A. Bought 30 BHB at $28.05 in Schwab Account (probable trade) and 25 in Fidelity account at $27.66-Long Term Holding:
I used commission free trades for both purchases.
Schwab:
Fidelity:
The shares rallied last Friday along with the entire banking sector as it became even more certain that corporate tax rates would be substantially reduced starting in 2018.
Closing Price 12/15/17: BHB $30.00 +$1.90 +6.76%: Bar Harbor Bankshares, Inc.
Conditions remain unfavorable for net interest margin expansion. Small banks like BHB will benefit by a reduction in their effective corporate tax rates and less regulation.
NIM may even contract as short term deposit costs rise while longer term rates remain stable or decline.
I now 250 shares in my Fidelity with an average cost per share of $17.79. As shown in the following snapshots, this 25 share purchase raised by average cost per share to $17.79 from from $16.69.
I have not been reinvesting the dividend, nor have I sold any shares in my Fidelity account.
My first purchase in my Fidelity account was a 50 share lot purchase at $32 (2/7/2012). Since then, there has been two 3 for 2 stock splits that resulted in that 50 share becoming 112.5 shares with an average cost per share of $13.4. BHB Split History
I am trading BHB in my Schwab account. I previously harvested a profit on a 100 share lot sold at $31.05:
| 2/11/2016 Trade |
I will flip this 30 share lot under the right circumstances while keeping the larger 250 share position. I may add 20 more shares in that account on a slide below $25.
The right circumstances would include still having commission free trades in that account that expire next August and over a $100 share profit-just more small ball.
Chart: The stock has been dead money for the past year: Bar Harbor Bankshares Interactive Chart One reason is the price got ahead of earnings growth with a move from less than $20 in January 2016 to $33 in March 2017.
BHB Effective Tax Rates: A reduction in the federal income tax rate to 21% will meaningufully benefit this bank.
2017 YTD and 2017 Third Quarter:
Page 57 2016 Annual Report 28.2% to 28.8% for 2014-16
The efficiency ratio is good at 53.59% and is trending down. The NPL, NPA and charge off ratios are excellent at .28%, .2% and .1% respectively.
Note that BHB helpfully provides NIM numbers with and without purchased loan accretion. I would use the without numbers, calling it a core number since this accounting adjustment is temporary and will run off. The core NIM did expand to 2.93% from 2.84% in the 2017 third quarter. Operating conditions do not yet favor much, if any, growth in this important number. The lack of NIM expansion is still a major negative for regional banks.
There is no analyst coverage. If I simply annualized the $.57 in core E.P.S. from the third quarter, and made no adjustments to reflect a lower tax rate and any future growth in operating earnings, the annual EPS would be $2.28 and the P/E would then be 12.3 based on a total cost per share of $28.05.
Dividend Growth Rate 5 Years: 8.5%
Bar Harbor Bankshares 5-Year Dividend Growth Rate (BHB)
The current quarterly penny rate is $.1867 per share. Bar Harbor Bankshares Declares Quarterly Cash Dividend
I am not reinvesting the dividend, preferring instead to pick my spots for share purchases.
Recent Acquisition: Bar Harbor Bankshares and Lake Sunapee Bank Group Complete Merger
I owned shares of Lake Sunapee when BHB made the announcement about acquiring this bank which expanded BHB's operations into New Hampshire and Vermont. I mentioned at the time that I viewed this acquisition as a positive for BHB shareholders.
The Lake Sunapee Bank still has the same name: Locations-Lake Sunapee Bank Bar Harbor Bank & Trust has 14 branches in Maine: Locations -Bar Harbor Bank & Trust
Results During the Last Recession-A Category 4 Hurricane for Banks:
I view it as important to look at financial results during the last recession. How did the bank weather the Near Depression storm? Given the severity of that event on bank earnings, I view a non-performing loan to total loan ratio of less than 2% and a charge off ratio of less than .5% as excellent during that period:
I also like to compare 2007 with 2008 so the 2012 annual report will have both of those years.
Remaining profitable and maintaining the dividend during recessions are also important. BHB increased the dividend as shown above.
Page 38 2012 Annual Report-SEC Form 10-K Unadjusted for Future Stock Splits
Visa Stock: BHB, like other banks, were issued Visa Class B, which can be converted into Class A shares, in connection with Visa's Reorganization and IPO in 2008. However, the shares can not be converted until certain litigation is settled and that does not appear likely anytime soon.
BHB Discussion:
Based on the current conversion rate, which may change as outlined above, BHB would be entitled to receive 19,158 Visa Class A shares upon settlement of what VISA calls the "covered litigation". This subject is way beyond what I will discuss in any detail. For anyone interested, more information can be found in VISA's SEC Filings (e.g. Annual Report for the F/Y Ending 9/30/17 at pages 70-72, 105-108) ("Payments totaling $528 million were made from fiscal 2014 through 2017 from the U.S. litigation escrow account reflecting settlements with a number of individual merchants that had opted out of the class settlement, resulting in an accrued balance of $978 million related to U.S. covered litigation as of September 30, 2017.") A class action settlement was thrown out by the Second Circuit Court of Appeals last year. Visa, MasterCard $7.25 billion settlement with retailers is thrown out: Reuters Visa has settled with some merchants that have opted out of the class actions as noted in the Annual Report linked above. This litigation may not end in my lifetime. I am confident, however, that the lawsuits are affording richly paid employment to a small army of lawyers.
VISA Inc. Cl A Stock Quote
2. Intermediate Term Bond/CD Ladder Basket Strategy:
A. Bought 2 Murfreesboro Tennessee 2% Water and Sewer Bonds Maturing on 6/1/2026:
EMMA Page
Murfreesboro - Google Maps (county seat of Rutherford County Tennessee and located 34 miles from Nashville)
Middle Tennessee State University, which has over 22K students, is located in Murfreesboro
Besides the tax free income generation and credit quality, I also bought this bond for its 2026 maturity.
Credit Rating: Aa1 by Moody's
Bought at a Total Cost of 97
YTM Then at 2.392%
Current yield at 2.062%
The Vanguard price was .2 higher for the same lot than Fidelity, and Vanguard charged $5 more than Fidelity in a commission. In other words, the seller's limit price was at 99.6 at Fidelity which would have given me a total cost per bond of 99.7. Vanguard marked the seller's limit price up to 99.8, possibly to pay an intermediary, and my total cost with that firm's commission was consequently at 97. I bought the bond in my Vanguard Taxable account since I had an excess amount of cash parked in my Vanguard Federal MM fund, that broker's settlement fund, that was paying 1.06% as of 11/28, which is taxable.
Optional Redemption: At par value on or after 6/1/23
Security:
Tax Matters: Federally Tax Free

Principal Amount: $270K
Cost: $267.45K
Tax Free Interest Annually: $8,009.
Cost: $267.45K
Tax Free Interest Annually: $8,009.
3. Short Term Bond/CD Ladder Strategy:
A. Bought 1 Treasury 1.5% Coupon Maturing on 5/31/19:
YTM at 1.685%

B. Bought 1 Treasury 1.375% Coupon Maturing on 7/31/18-A Roth IRA Account:
YTM at 1.45%

I now own 2 bonds.
C. Bought 1 Treasury 1.5% Coupon Maturing on 5/15/2020:
YTM at 1.783%

D. Bought 1 BP Capital 1.768% SU Bond Maturing on 9/19/19:

YTM at TC = 1.964%
Current Yield at TC = 1.7442%
Current Yield at TC = 1.7442%
E. Bought 1 Treasury 1.5% Coupon Maturing on 2/28/19-A Roth IRA Account:
YTM at 1.651%

YTM at 1.651%
I now own 2 bonds.
F. Bought 1 Premier Business Bank 1.5% CD (monthly interest payments) Maturing on 9/14/18 (9 month CD):
 Holding Company: PBB Bancorp (PBCA)
Continued Record High Growth Reported from PBB Bancorp for Third Quarter 2017
PBB is a tiny bank holding company: 2016 Annual Report.PDF (capital ratios at page 35)
G. Bought 2 First National Bank of Pennsylvania 1.4% CDs Maturing on 6/6/18 (6 month CDs):
 Holding Company: F.N.B. Corp. (FNB)
F. Bought 1 Premier Business Bank 1.5% CD (monthly interest payments) Maturing on 9/14/18 (9 month CD):
Continued Record High Growth Reported from PBB Bancorp for Third Quarter 2017
PBB is a tiny bank holding company: 2016 Annual Report.PDF (capital ratios at page 35)
G. Bought 2 First National Bank of Pennsylvania 1.4% CDs Maturing on 6/6/18 (6 month CDs):
FNB Analyst Estimates
F.N.B. Corporation Reports Third Quarter 2017 Earnings
RATED at 3 Stars by Bankrate: First National Bank of Pennsylvania Reviews and Ratings - Bankrate.com
I will trade FNB common shares as part of my regional bank basket strategy. Currently, I own just 60 shares, recently buying 10 shares using a commission free trade at $13.04. Item # 1.C. (11/30/17 Post) That was an average down from a 50 share purchase at $13.59 which in turn was made shortly after selling 100 shares at $13.94 Items 4.A and 4.B.
Under the circumstances and for the reasons previously explained, it is impossible for me to stay with this stock as a long term hold.
4. Small Ball:
A. SOLD 30 AMJ at $27.05 ($1 Commission/IB Trading Account):

Profit Snapshot: +$59.48
ITEM # 2 Bought 30 AMJ at $25 Update For Portfolio Positioning And Management As Of 3/3/16 - South Gent | Seeking Alpha
Quote: JPMorgan Alerian MLP ETN (AMJ)
After adding to my AMU position, which is similar to AMJ, I decided to pare my AMJ position into a small rally.
5. Equity REIT Common and Preferred Stock Basket Strategy:
A. Pared APLE-SOLD 50 at $19.6:

Profit Snapshot: +$70.52

QUOTE: Apple Hospitality REIT Inc.
Item # 1.B. Bought 50 APLE at $18.15-IB Trading Account (7/31/17 Post)
Last Pares:
Item # 6.B. Sold Highest Cost Lot in Schwab at $19.22 (10/19/17 Post);
Item 2.B. Sold 100 APLE at $19.43(5/25/17 Post)
Shares Currently Owned:
Item # 2.B. Bought 50 APLE at $17.92-Schwab Account (8/29/17 Post)
Item #2.C. Bought 50 APLE at $18.3- A Roth IRA Account (5/25/17 Post)
Item 2.C. Bought 50 APLE at $18.22-Fidelity Account-Used Commission Free Trade (7/31/17 Post)
I am reinvesting the dividend.
Dividends: Monthly at $.10 per share

B. Bought 50 HT at $17.41-Used Commission Free Trade:

Quote: Hersha Hospitality Trust Cl A (HT)
Closing Price 12/15/17: HT $17.68 +$0.24 1.38%
Company Website: Hersha Hospitality Trust ("Hersha Hospitality Trust (HT) is a self-advised real estate investment trust in the hospitality sector, which owns and operates high quality upscale hotels in urban gateway markets. The Company's 51 hotels totaling 7,804 rooms are located in New York, Washington, DC, Boston, Philadelphia, Miami and select markets on the West Coast.")
Hersha Hospitality Trust - Properties by Region
This REIT had to close 6 hotels in Florida due to Hurricane Irma earlier this year. That negatively impacted third quarter results. AFFO declined to $.61 per share for the Q/E 9/30/17 compared to $.72 in the Q/E 9/30/16. Hersha Hospitality Trust Announces Third Quarter 2017 Results
Dividend: Quarterly at $.28 per share
Hersha Hospitality Trust Announces Quarterly Dividends
Dividend Yield at a TC of $17.41 per share = 6.433%
3 Year Chart Suggests Trades Rather Than Holds-Hersha Hospitality Trust Cl A Interactive Chart
Previously I eliminated my HT position in 2016 and have not bought back shares until this last 50 share purchase on 12/8/17.
2016 Round Trip HT Trades:
Total Profit: $171.92
It simply has not paid to hold this stock longer term since I first bought shares last year.
I last discussed a purchase here: Item # 1. Bought 50 HT at $18.25-Roth IRA Account: Update For Equity REIT Basket Strategy As Of 8/27/16 - South Gent | Seeking Alpha
On 12/12/17, shortly after my last purchase, Barclays downgraded HT from equal weight to underweight and lowered its price target to $17 from $19.
HT Cumulative Preferred Stocks:
I prefer buying HT cumulative preferred stocks when the price falls below par value. So far, I have bought and sold only the Series D.
I have eliminated my position in the Series D stock cumulative equity preferred stock. Item # 1.A. Sold 50 HTPRD at $25.85-Roth IRA; Item ## 2.A., 2.B., & 2.C.: Sold 150 HTPRD in Three 50 Share Lots at $25.8 (total profits = $313.49)
Hersha Hospitality Trust 6.875% Cum. Redeem. Pfd. Series C (callable at par on or after 3/16/18- Prospectus)
Hersha Hospitality Trust 6.5% Cum. Redeem. Pfd. Series D (callable at par on or after 5/31/2021-Final Prospectus Supplement)
Hersha Hospitality Trust 6.5% Cum. Redeem. Pfd. Series E (callable at par on or after 11/7/2021-Final Prospectus Supplement)
My lowest purchase price for the Series D was at $22.28 (12/20/16). Comment
There was a slight pop in interest rates after the 2016 election which caused a downdraft in preferred stock prices. (see also, Item # 3.A. Bought 50 HTPRD at $24.95; Item 3.B. Bought 50 Shares HTPRD at $24.95) Another spike in interest rates will result in these preferred stocks falling in value again. I will just wait for another buying opportunity.
F.N.B. Corporation Reports Third Quarter 2017 Earnings
RATED at 3 Stars by Bankrate: First National Bank of Pennsylvania Reviews and Ratings - Bankrate.com
I will trade FNB common shares as part of my regional bank basket strategy. Currently, I own just 60 shares, recently buying 10 shares using a commission free trade at $13.04. Item # 1.C. (11/30/17 Post) That was an average down from a 50 share purchase at $13.59 which in turn was made shortly after selling 100 shares at $13.94 Items 4.A and 4.B.
Under the circumstances and for the reasons previously explained, it is impossible for me to stay with this stock as a long term hold.
4. Small Ball:
A. SOLD 30 AMJ at $27.05 ($1 Commission/IB Trading Account):
Profit Snapshot: +$59.48
ITEM # 2 Bought 30 AMJ at $25 Update For Portfolio Positioning And Management As Of 3/3/16 - South Gent | Seeking Alpha
Quote: JPMorgan Alerian MLP ETN (AMJ)
After adding to my AMU position, which is similar to AMJ, I decided to pare my AMJ position into a small rally.
5. Equity REIT Common and Preferred Stock Basket Strategy:
A. Pared APLE-SOLD 50 at $19.6:
Profit Snapshot: +$70.52
QUOTE: Apple Hospitality REIT Inc.
Item # 1.B. Bought 50 APLE at $18.15-IB Trading Account (7/31/17 Post)
Last Pares:
Item # 6.B. Sold Highest Cost Lot in Schwab at $19.22 (10/19/17 Post);
Item 2.B. Sold 100 APLE at $19.43(5/25/17 Post)
Shares Currently Owned:
Item # 2.B. Bought 50 APLE at $17.92-Schwab Account (8/29/17 Post)
Item #2.C. Bought 50 APLE at $18.3- A Roth IRA Account (5/25/17 Post)
Item 2.C. Bought 50 APLE at $18.22-Fidelity Account-Used Commission Free Trade (7/31/17 Post)
I am reinvesting the dividend.
Dividends: Monthly at $.10 per share
B. Bought 50 HT at $17.41-Used Commission Free Trade:
Quote: Hersha Hospitality Trust Cl A (HT)
Closing Price 12/15/17: HT $17.68 +$0.24 1.38%
Company Website: Hersha Hospitality Trust ("Hersha Hospitality Trust (HT) is a self-advised real estate investment trust in the hospitality sector, which owns and operates high quality upscale hotels in urban gateway markets. The Company's 51 hotels totaling 7,804 rooms are located in New York, Washington, DC, Boston, Philadelphia, Miami and select markets on the West Coast.")
Hersha Hospitality Trust - Properties by Region
This REIT had to close 6 hotels in Florida due to Hurricane Irma earlier this year. That negatively impacted third quarter results. AFFO declined to $.61 per share for the Q/E 9/30/17 compared to $.72 in the Q/E 9/30/16. Hersha Hospitality Trust Announces Third Quarter 2017 Results
Dividend: Quarterly at $.28 per share
Hersha Hospitality Trust Announces Quarterly Dividends
Dividend Yield at a TC of $17.41 per share = 6.433%
3 Year Chart Suggests Trades Rather Than Holds-Hersha Hospitality Trust Cl A Interactive Chart
Previously I eliminated my HT position in 2016 and have not bought back shares until this last 50 share purchase on 12/8/17.
2016 Round Trip HT Trades:
| Sold 50 at $18.95 +$95.47 |
 |
| Sold 100 at $18.72 +$53.81 |
 |
| Sold 50 Roth IRA at $18.98 +$22.54 |
It simply has not paid to hold this stock longer term since I first bought shares last year.
I last discussed a purchase here: Item # 1. Bought 50 HT at $18.25-Roth IRA Account: Update For Equity REIT Basket Strategy As Of 8/27/16 - South Gent | Seeking Alpha
On 12/12/17, shortly after my last purchase, Barclays downgraded HT from equal weight to underweight and lowered its price target to $17 from $19.
HT Cumulative Preferred Stocks:
I prefer buying HT cumulative preferred stocks when the price falls below par value. So far, I have bought and sold only the Series D.
I have eliminated my position in the Series D stock cumulative equity preferred stock. Item # 1.A. Sold 50 HTPRD at $25.85-Roth IRA; Item ## 2.A., 2.B., & 2.C.: Sold 150 HTPRD in Three 50 Share Lots at $25.8 (total profits = $313.49)
Hersha Hospitality Trust 6.875% Cum. Redeem. Pfd. Series C (callable at par on or after 3/16/18- Prospectus)
Hersha Hospitality Trust 6.5% Cum. Redeem. Pfd. Series D (callable at par on or after 5/31/2021-Final Prospectus Supplement)
Hersha Hospitality Trust 6.5% Cum. Redeem. Pfd. Series E (callable at par on or after 11/7/2021-Final Prospectus Supplement)
My lowest purchase price for the Series D was at $22.28 (12/20/16). Comment
There was a slight pop in interest rates after the 2016 election which caused a downdraft in preferred stock prices. (see also, Item # 3.A. Bought 50 HTPRD at $24.95; Item 3.B. Bought 50 Shares HTPRD at $24.95) Another spike in interest rates will result in these preferred stocks falling in value again. I will just wait for another buying opportunity.
Disclaimer: I am not a financial advisor but simply an individual investor who has been managing my own money since I was a teenager. In this post, I am acting solely as a financial journalist focusing on my own investments. The information contained in this post is not intended to be a complete description or summary of all available data relevant to making an investment decision. Instead, I am merely expressing some of the reasons underlying the purchase or sell of securities. Nothing in this post is intended to constitute investment or legal advice or a recommendation to buy or to sell. All investors need to perform their own due diligence before making any financial decision which requires at a minimum reading original source material available at the SEC and elsewhere. A failure to perform due diligence only increases what I call "error creep". Stocks, Bonds & Politics: ERROR CREEP and the INVESTING PROCESS Each investor needs to assess a potential investment taking into account their personal risk tolerances, goals and situational risks. I can only make that kind of assessment for myself and family members.

"The most serious negative impact will be moving forward the Day of Reckoning by several years, which I define as a massive U.S. government fiscal crisis evidenced first by a series of failed treasury auctions and a black hole developing in the U.S. stock market. "
ReplyDeleteHello southgent,
I am a little behind on my reading of your blog.
I quoted above the vision of the future that you have and how the GOP has really only made the federal debt worse and the lives of the middle class more problematic.
I wondered specifically in the above comment about the reasons for hyperinflation, up and above a normalization of the interest rate curve. I an not sure what you meant by a black hole in the markets.
I understand that a rise in federal debt is very problematic, but I guess I'm having a little trouble getting my head around the idea that with even high rates, foreign governments will not purchase our bonds as they have done in the past.
Thanks
SAM
Sam: I am not talking about something that will happen in 10 or even 15 years. My forecast is the U.S. government's financial crisis will occur in about 20-25 years from now, more likely earlier than later than that time frame.
DeleteI am forecasting what will happen IMO based on what I view as inevitable in the U.S.
U.S.government debt will continue to move up in a parabolic fashion, as will state and local government debt.
The U.S. will continue to sap the world's saving pool in rapidly increasing amounts. Interest expense on the debt will likely surpass $1 trillion per year in 7 years.
Eventually foreigners will rationally conclude that they will no longer feed this reckless spending that Americans have no desire to fund with taxes. The problems will be aggravated of course by spending on entitlement programs for the baby boom generation.
What we all need to grasp is how U.S. debt has accelerated since 1979 when the total U.S. debt was less than $1 trillion. The number stands at the moment at $20,492,949,732,212.36.
https://treasurydirect.gov/NP/debt/current
The end game then involves the pullback in foreign purchases of U.S. securities accompanied by a rapid decline in the USD. The U.S. currency will also lose its status as the reserve currency.
Foreign purchasers start to pull money out of U.S. debt obligations rather than adding to their positions. The result is that the treasury can no longer sell enough treasuries to retire existing debt and to finance new deficit spending.
The failed treasury auctions ensue, probably with the FED buying what can not be sold, which causes an even steeper decline in the USD since that would be viewed as debt monetization.
The U.S. stock market is not sanguine about these developments and would be falling fast and furious-a black hole sucking out wealth. The wealthy would be long gone with their treasure to places like Switzerland seeing the writing on the wall.
I would recommend following on a monthly basis this data.
http://ticdata.treasury.gov/Publish/mfh.txt
U.S. debt is still attractive at the moment compared to other sovereign bonds and foreigners in the aggregate are still adding to their overall positions. Note the decline in Japan's holdings however, the second largest foreign country owner. China is the largest and is trending down over the past three months.
Hello southgent, thanks for your detailed answer about the future. I had another question about negative interest rates, QE, disinflationary forces around the world
ReplyDeleteI know you are buying short-term debt and the yield curve is flattening. I know that you consider a lot of disinflationary forces happening around the world.
I wonder if the Fed is too aggressive next year that we will have an inverted yield curve albeit at very low rates and whether you consider this just monetary manipulation or a precursor to recession?
thanks
I would view an inversion next year as signaling recession. The intermediate and long end of the curve is still being manipulated and consequently those interest rates are not market based rates. For the Bond Ghouls to give a signal about a looming recession, the market will have to be free of CB rate manipulation. The primary culprits now are the ECB and the BOJ with smaller European central banks continuing negative benchmark rates for at least as long as the ECB. Other CBs, like the Bank of Canada, have been pursuing real negative interest rate monetary policies with their benchmarks set at levels last seen even now in the Great Depression.
DeleteYellen agrees but for a different reason.
https://www.reuters.com/article/us-usa-fed-yellen-curve-graphic/flat-u-s-yield-curve-not-signaling-recession-risk-yellen-idUSKBN1E8019?il=0
Forgot to add the word "not" in the first sentence. Brain malfunction.
DeleteThe first sentence should read " I would not view an inversion...
Great answer thanks!
ReplyDeleteIn the portfolio management section, I mentioned that a two month 1.1% Bank of China CD matured today. I am reallocating the proceeds into another two month Bank of China CD that has a 1.4% coupon.
ReplyDeleteAs long as this kind of yield step up continues, I am satisfied with the trickles of additional income and hope that short rates continue to increase throughout 2018.
Intermediate and long term interest rates are rising today and that is causing a decline in REIT stocks.
ReplyDeleteiShares 7-10 Year Treasury Bond ETF
$105.35 -$0.53 -0.50%
Last Updated: Dec 19, 2017 at 12:14 p.m. EST
https://www.marketwatch.com/investing/fund/ief
Vanguard REIT ETF
$84.21 -$1.42 -1.66%
Last Updated: Dec 19, 2017 at 12:15 p.m. EST
https://www.marketwatch.com/investing/fund/vnq
A common misconception IMO is that REITs will not respond negatively to a rise in interest rates and may even rise. Those who make that argument will point to the 2004-2006 period when the FF rate rose from 1% to 5.25% and the REIT index rose substantially.
The NAREIT Equity REIT index rose 24.35%, 6.67%, and 29.51% in 2004, 2005 and 2006 respectively. The mortgage REIT index did react negatively to the rise in short term rates falling 23.19% in 2005 after being up 18.43% in 2004.
Data can be downloaded here:
https://www.reit.com/data-research/reit-indexes/annual-index-values-returns
REIT financing is primarily sourced in the intermediate range near 5 years. Some REITs will have longer term bonds outstanding but commercial mortgages generally have 5 to 7 year terms. The intermediate term range initially declined in yield when the FED started to raise the FF rate in the 2004 summer and remained favorable for REIT financing throughout that period, particularly compared to the inflation rate. Economic conditions were also favorable.
A much different reaction occurred during the interest rate spike in 2013. REIT common and preferred shares were shellacked in price as the ten year treasury moved from 1.66% in May to 3.04% by year end, even though short rates remained near zero due to ZIRP. I started my REIT basket strategy in September 2013.
Another factor is whether operating costs are rising faster than headline CPI that is used in rent escalations.
It is all about context and identifying all of the variables that will impact profits and eventually stock prices.
Even the ostrich is paying more attention!!
ReplyDeletehttps://www.alternet.org/news-amp-politics/paul-krugman-gop-completely-hopelessly-corrupt
SAM
The Bond Ghouls headed for the exits today:
ReplyDeleteU.S. 10 Year Treasury Note
2.466% +0.074
The one year chart suggests a possible break-out to higher levels.
https://www.marketwatch.com/investing/bond/tmubmusd10y/charts?countrycode=bx
Potential upside break-outs have stalled near the 2.6% since the election.
On 11/8/16 the ten year yield closed at 1.65% and spurted up to 2.6% by mid-December:
https://www.treasury.gov/resource-center/data-chart-center/interest-rates/Pages/TextView.aspx?data=yieldYear&year=2016
The next spike petered out at 2.62% on 3/13/17:
https://www.treasury.gov/resource-center/data-chart-center/interest-rates/Pages/TextView.aspx?data=yieldYear&year=2017
The yields on 1 month to 1 year treasury bills were down or unchanged today.
The 5 year has seen a significant percentage increase after closing at 1.63% yield on 9/7/17. The yield today closed at 2.23%. While that may not look like much, that is a 36.8% increase in a little over 3 months.
The 3 month T Bill appears ready to stabilize in the 1.35% to 1.4% range until the next FED hike or a few weeks prior when the hike looks almost certain. The CME model has an 84% probability of a .25% hike in June 2018. The odds of a .5% hike through the June meeting increased from yesterday and is a meaningful number.
http://www.cmegroup.com/trading/interest-rates/countdown-to-fomc.html
I noticed that Bitcoin has been plunging in value since this news story was published by Bloomberg:
ReplyDeletehttps://www.bloomberg.com/news/articles/2017-12-18/europe-wants-to-regulate-bitcoin-to-clamp-down-on-illegal-risks
It seems obvious to me that governments will act in concert to compel trading information disclosure.
Bitcoin USD
$16,856 -$205 -1.20%
https://www.marketwatch.com/investing/cryptocurrency/btcusd
It may require actual firm action rather than talk of such action before those involved see the handwriting on the wall.
Looks like the Bond Ghouls are experiencing what is now only a mild anxiety attack.
ReplyDeleteiShares 7-10 Year Treasury Bond ETF
$105.09 -$0.31 -0.29%
https://www.marketwatch.com/investing/fund/ief
The longer duration treasuries did worse today:
iShares 20+ Year Treasury Bond ETF
$124.14 -$1.39 -1.11%
https://www.marketwatch.com/investing/fund/tlt
PIMCO 25+ Year Zero Coupon U.S. Treasury Index ETF
$117.31 -$2.2709 -1.90%
https://www.marketwatch.com/investing/fund/zroz
A similar case of the shakes started after Trump was elected and was based on the fear that his expansionary fiscal policies would lead to higher inflation. Large tax cuts are viewed as an expansionary fiscal policy.
Higher inflation may occur next year compared to 2017, but it is still too early to make an actionable forecast now given what may turn out to be a dud on the GDP and wage growth.
The German 10 year bond has been ticking up some as well but remains deep into a likely negative real yield:
https://www.marketwatch.com/investing/bond/tmbmkde-10y?countrycode=bx
+++
The talking heads have been saying sell the news on the tax cut.
Maybe that will happen simply because just about everyone thinks it will happen which tends to make it happen for that reason, at least for the short term.
Today had a feel of selling on the news for several sectors that have benefited the most in the recent run up based on that their effective tax rates would be significantly lower starting in 2008. Still no conclusions are even capable of being drawn with a S & P 500 decline of .08% today.
KRE did decline .4%, more than the S & P 500.
Utility stocks have had a bad 30 days or so, relatively speaking, as the major indexes climbed to new records. XLU closed at $56.87 on 11/14/17 and at $53 today.
https://www.marketwatch.com/investing/fund/xlu/charts
The VIX declined by 3.09%, closing at 9.72.
The VIX's movement is well within the parameters of the Stable Vix Pattern, and has been moving within it most bullish pattern of less than 15 over the past year or so with occasional and temporary peeks above 15 which are meaningless IMO. The movement below 10 has been far more notable than the peeks over 15.
https://tennesseeindependent.blogspot.com/2009/05/vix-asset-allocation-model-explained.html
https://www.marketwatch.com/investing/index/vix/charts
I have published a new post:
ReplyDeletehttps://tennesseeindependent.blogspot.com/2017/12/observations-and-sample-of-recent_21.html