Tuesday, October 28, 2014

Update for Regional Bank Basket Strategy/FNFG: A Case Study In Value Destruction/Added 50 ONB at $12.45/Sold 100 TRMK at $24.45

The regional bank basket strategy will be randomly updated by itself, though a minimum of 30 days will need to elapse before the next update.  

I frequently use a basket approach, particularly with industry sectors, that will vary in size as to the number of components. The focus will be on the total return of the basket, rather than individual components. Some of the advantages to this approach include diversification and risk mitigation. I am not concerned about a few mishaps provided other components are doing better than I anticipated when I made the initial purchase. As noted previously, I have been surprised by some of best and worst performers in the regional bank basket.

Last Update: Update for Regional Bank Basket Strategy (9/29/14 Post)


1. Update for Regional Bank Basket Strategy:

This strategy is explained in my Gateway Post on this topic:

Snapshots of realized gains and losses can be found at the end of that post.

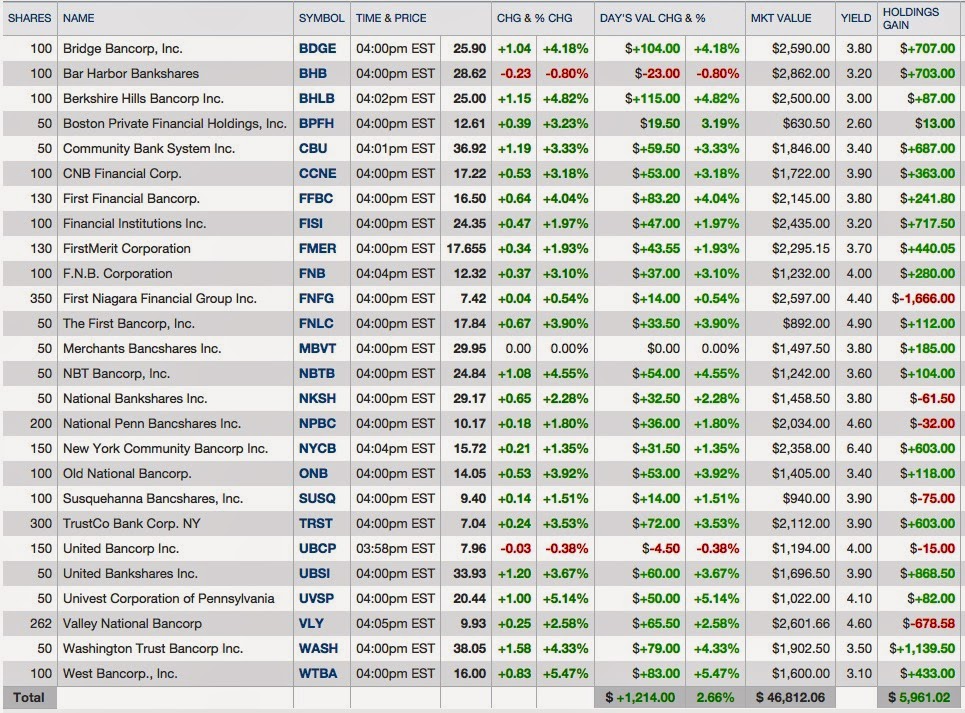
The dividend yield showed in this table is calculated by Yahoo Finance based on last Friday's close. My dividend yield for each position will be different based on my total cost numbers. In most cases, with FNFG and VLY being notable exceptions, my dividend yield will be higher.

Dividend Yields 5% or higher: Based on Total Cost
NYCB: 8.44%
WASH: 8.34%
UBSI: 7.66%
FNLC: 5.38%
CBU: 5.15%
TRST: 5.1%
CCNE: 5.%

I am not tracking reinvested dividends in the following table. The unrealized gains per holding do not include reinvested dividends.

Over the life of this basket strategy, I anticipate that the dividends will provide 40% to 50% of the total return. I am generally keeping my total exposure between $40,000 to $50,000.

After a number of adds, I am now over my minimum $40,000 allocation after a bout of profit taking last year.

SPDR S&P Regional Banking ETF (KRE) Total Returns47.5% in 2013

One ETF will own several of the small cap regional banks and REITs that I own now or have owned in the past: PSCF | S&P SmallCap Financials Portfolio

In 2013, my dividend total from this basket totaled $1,932,93, up from $1,896.25 in 2012 and $1,660.57 in 2011. I will have to increase my current exposure in order to exceed the 2013 amount this year, given my light exposure for the first four months which was several thousand below the "minimum" level. 

Regional bank stocks are basically churning in price this year as interest rates started to go back down. One of the regional bank ETFs, KRE, closed at $40.61 on 12/31/13 and at KRE: 38.93 +1.02 (+2.69%) today, but has closed as low as $36.84 this year (2/3/14). SPDR S&P Regional Banking ETF ETF Chart

I have nibbled at this ETF: Bought Taxable Accounts: 50 KRE at $39.55 (9/20/14 Post)

The abnormally low rates benefited banks some when deposit yields were repriced down, but even 5 year bank CDs taken out in 2008 at higher rates have now matured, and the positive impact of that repricing is no longer present to any meaningful degree. 

Instead, the decline in rates for loans simply compresses net interest margin. When rates were rising last year, regional bank stocks were in an uptrend based on the common belief that higher intermediate and long rates would be a net positive for them, particularly when short terms were likely to remain near zero through mid-2015 and then rise slowly and modestly in 2016-2017. The rate spike starting last May impacted intermediate and long term rates. Short term rates remained anchored by ZIRP. 

I have used the downdraft in prices this year to add positions to my basket after selling into last year's strength.

Since the last update, I have eliminated three positions: Sold 50 AMNB at $23.03; Sold:  100 HBAN at $9.53 (10/17/14 Post). The third is briefly mentioned below.

I  added a 50 share lot of ONB, mentioned below.

The yields shown in the table below are calculated by Yahoo Finance based on today's closing prices rather than at my total cost per share. 

Realized Gains 2010 to Date: $16,675.08   (snapshots in Gateway Post)(excludes TRMK profit discussed below, waiting for broker calculation)
Dividends Received 2010 through 2013=$6,623.72

Click to Enlarge:
Regional Bank Basket as of 10/28/14
********

Comparison Data From the St. Louis Fed:

Net Interest Margin for all U.S. Banks
Net Interest Margin for U.S. Banks with average assets under $1B
Net Interest Margin for U.S. Banks with average assets between $1B and $15B
Return on Average Equity for all U.S. Banks   (abbreviated to "ROE")
Return on Average Assets for all U.S. Banks (abbreviated to "ROA")
Nonperforming Loans (past due 90+ days plus nonaccrual) to Total Loans for all U.S. Banks (abbreviated to "NPL ratio")
Charge-Off Rate On All Loans, All Commercial Banks
Assets at Banks whose ALLL exceeds their Nonperforming Loans (I prefer a coverage ratio of  over 100% at the time of my initial purchase)(ALLL=Allowance for loan losses)

New Capital Rules From the FDIC to Implement Basel III Capital Rules: 

 
********** 

Google deleted about 15 discussions of third quarter bank earnings reports when the entire update for the three baskets was deleted by it last Friday. I subsequently discussed in more depth than usual two of those earnings reports at SA and will not rewrite the others. Regional Bank Basket Strategy: West Bancorporation Earnings Report Today - South Gent | Seeking AlphaRegional Bank Basket Strategy: Bridge Bancorp 3rd Quarter Earnings Release - South Gent | Seeking Alpha I may discuss one more report that has not yet been released at SA.

1. First Merit (FMER):  FirstMerit reported third quarter net income of $63.9M or $.37 per share, which was in line with the consensus estimate.

Performance Ratios
Asset Quality

After selling my 100 highest cost shares, I currently own 141+ at an average cost per share of $14.52: Item # 2 Bought 30 FMER at $11.35 (August 2011)Item # 2 Added 50 FMER at $15.2 (September 2012)Item # 3 Added 50 FMER at $15.09 (February 13, 2013 Post) The foregoing purchases account for 130 of the 141+ shares with shares purchased with dividends accounting for the remainder.

I rate FMER as a hold. I am reinvesting the dividend at the moment.

FMER Interactive Chart

Berkshire Hills Bancorp (BHLB): Berkshire Hills reported core earnings per share of $.46 up 7% Y-O-Y:


I have harvested one gain so far: Item # 1 Sold 50 BHLB at $28.74+ (7/13/13 Post)-Item # 2 Bought 50 BHLB AT $21.66 (3/12/12 Post)

The stock burst through its 50 and 200 day SMA lines to the upside today BHLB Interactive Chart

3NBT Bancorp (NBTB): NBT Bancorp reported core net income of $19.8M or $.45 per share.

The consensus estimate was for $.44. NBTB Analyst Estimates


NBTB is currently trading above its 50 and 200 day SMA lines: NBTB Interactive Chart

4. First Niagara: My disaster in this basket is FNFG, a loser that keeps on giving. My original investment thesis was okay. My mistake was keeping the stock after I recognized that the $1B acquisition of HSBC branches was idiotic and boneheaded in the extreme. It might be a toss up on whether the Board's approval of that train wreck was stupider than my decision to keep the stock after calling it a stupid decision.

These posts were written in 2011: First Niagara: Just Another Incompetent Bank Board of DirectorsFirst Niagara Dividend Slash I have been critical of FNFG's inept Board and management team for over three years but I held onto to the stock hoping that a larger bank would rescue this beached whale. The odd thing about First Niagara is that it weathered the Near Depression period just fine. The massive destruction of shareholder equity did not start until 2011.

The last report was just pathetic. The bank wrote down $800 million in its boneheaded acquisition resulting in a GAAP loss to shareholders of $1.9 per share. A $45M reserve was set aside for something oblique called a "process issue related to certain customer deposit accounts". Wow, that was the first time that I have seen that decree of ineptitude.  First Niagara Reports Third Quarter 2014 Results

Management is also spending a great deal of money upgrading its computer systems and I wonder whether that process issue is related that "upgrade".  I noted in an earlier post that the new CEO (the other one was sent out to pasture) had embarked on a spending spree to upgrade FNFG's systems that will retard earnings for several years and have uncertain benefits. That plan caused a slide in the price earlier this year, FNFG Interactive Chart. (price went from $10.48 on 1/22/14 to $8.22 on 2/3/14).

FNFG is easily the worst managed bank in my basket.

I have been hoping that another bank will end the misery of FNFG's shareholders by making a generous acquisition offer, sending the current management team and Board into an early and much deserved retirement where they can not inflict further harm on the innocent.

Perhaps, that "hope" is born from early onset dementia.

I am reinvesting the dividend which was cut in half a few years ago to help finance the indefensible acquisition of HSBC branches for $1B in cash which was called a "home run" by the now departed CEO who engineered it. Incompetence piled on top of incompetence.

I am an involuntary holder of FNFG stock. While the Board did declare a dividend for the current quarter, further dividends will have to be approved through 2017 by the regulator due to that massive write-off.

4. Sold 100 TRMK at $24.45-In a Satellite Taxable Account (see Disclaimer): Regional bank stocks were having a robust move today, so I decided shortly before the close to sell one position into the rally.  This last transaction completes my 4th round-trip in TRMK shares. I simply elected to exit this obvious trading position rather than to take a chance on the earnings report which was scheduled to be released after the close.

Snapshot of Trade: 


Snapshot of Profit (includes earlier 50+ share disposition):


2014 TRMK 100 Shares +$119.1
I bought this lot a few weeks ago. Item # Bought 100 TRMK at $23.12 (8/9/14)

I held the shares long enough to receive one dividend:

Quarterly Dividend=$23 on 100 Shares
Total Return=$142.1 or 6.13% annualized (holding period about 3 months)

Item # 1 Sold Taxable Accounts: 50+ TRMK at $24.63 (7/19/14 Post)-Item # 6 Bought: 50 TRMK at $22.73 (5/10/14 Post)Item # 3 Bought 50 TRMK at 19.57 August 2010-Item # 3 Sold 50 TRMK at 24.7 January 2012Item # 1 Sold 50 Trustmark at $26.52 July 2013-Bought 50 TRMK at $21.54 November 2012 (snapshots in Gateway Post for Regional Bank Basket)

Total Realized Gains from 3 Fifty Share Lots: $555.03

Total Realized Gain 4 TRMK Trades in the Regional Bank Basket= $674.13

The consensus 3rd quarter E.P.S. was for $.44: TRMK Analyst Estimates The bank reported net income of $33.6M or $.50 per share. SEC Filed Press Release

5. Added 50 ONB Shares at $12.45 (see Disclaimer): I discussed this purchase in a SA Instablog: Regional Bank Basket Strategy: Added 50 ONB At $12.45 - South Gent | Seeking Alpha

Subsequent to that purchase, ONB reported better than expected earnings. Old National's 3rd Quarter Highlighted by 6.5% Annualized Organic Loan Growth (Excluding Covered Loans) and a Continued Strong Loan Pipeline

Closing Price 10/28/14:  ONB: $14.05 +0.53 (+3.92%) 

SA Instablog Published Discussing Add of MSPRA at $19.87

Equity Preferred Floating Rate Stocks: Added To MSPRA At $19.87 - South Gent | Seeking Alpha

SA Instablog Published Discussing Novartis-Dividend Growth Strategy

I published earlier today the third installment discussing a stock that is owned under my dividend growth strategy. 


Novartis reported earnings this morning which I discuss in that post. 

Monday, October 27, 2014

Update for Equity REIT Common and Preferred Stock Basket Strategy/OHI Earnings Report and Dividend Increase

Housekeeping: Google remains frequently unable to connect visitors to this blog using the correct blog URL.  Instead of using the blog URL, I bookmark a link to the most recent month in the blog archive section to the right. Stocks, Bonds & Politics: October 2014 This solves the access problem, at least for now. 

Google deleted my updates for the regional bank, REIT and Lottery Ticket basket strategies when I attempted to open the draft. 

I do not want to publish these updates as an SA Instablog. What I will do now is limit a post to one basket strategy and haphazardly publish them along with updates on other portfolio strategies including the CEF Portfolio and the Exchange Traded Bonds and Preferred Stock Portfolio. These updates will have no set time period associated with their publication. 

There are several reasons for changing the updating schedule and format. The most important is that I can write and publish the post at one sitting, thereby giving Google fewer opportunities to lose a draft which has occurred twice recently after the draft was saved and when I merely attempted to open it, as I have done since first I first published here back in October 2008.

1.  Update for Equity REIT Common and Preferred Stock Basket Strategy:  

This basket strategy was last updated on 9/29/14

For the reasons discussed in a March 2014, I started a tactical allocation shift into REIT common and preferred stocks starting in September 2013. Equity REIT Common and Preferred Stock Table as of 3/5/14 This particular shift started after prices had significantly corrected in the May to September 2013 time frame. Most of my best buys were made in December 2013 that marked the high point in the correction process. 

I still own three of those: 


I viewed the 2013 correction to have two primary causes. 

First, REIT valuations had hit stretched valuation levels by May 2013 based on historical norms, 

Second, interest rates started to spike in May 2013, making alternative income investments more attractive compared to REITs for some investors. The 10 year treasury closed at a 1.66% yield on 5/1/13 and had risen to 3.04% by 12/31/13. Daily Treasury Yield Curve Rates

Aggregate P/FFO data can be found in Lazard's monthly Real Estate Report

After the bell today, Omega Healthcare reported FFO and AFFO at $.73 per share, beating estimates by either two or three cents per share depending on the service providing the consensus number. Omega recently announced the ninth consecutive dividend increase raising the quarterly payout by 1 cent to $.52. OHI Dividend Date & History 

Closing Prices 10/27/14:


Since the last update, I have not sold any securities. I currently have a total realized gain of $2,967.97 (snapshots at Gateway Post: Equity REIT Common and Preferred Stock Basket) Profits from Canadian REIT sells are reported here in USDs, which is the 1099 tax reporting requirement even though I am using CADs to buy and receiving CADs when I sell. So far, my CAD profit from those sales have been higher. The decline in the CAD vs. the USD results in a lower reported taxable profit.   

I have purchased the following securities since the last update: 


Added 200 DRG:CA at C$8.92 (10/20/14 Post)


The additional 100 share purchase of LXP in a Roth IRA, noted above, is part of an ongoing transitioning of the entire position to the Fidelity ROTH IRA. I discuss the reasons for the repositioning in this SA Instablog: Lexington REIT (LXP) - South Gent | Seeking Alpha

I have an a GTC Limit Order to Sell the LXP shares owned in a taxable account slightly above the closing price today.

Click To Enlarge: 

Equity REIT Basket As of 10/27/14
The worst selection in this grouping is CCG, but I only bought 150 shares. 

I am not tracking reinvested dividends in this table. 

As previously noted, I have pared my Canadian REIT exposure. I buy those securities using my CAD stash on the Toronto exchange. I receive their monthly dividend payments in CADs. I did add 200 shares of Dream Global Real Estate Investment Trust  (DRG.UN:TOR) since my last update. 

Since starting this basket strategy, I have owned one REIT that received a takeover offer within a few weeks after I established a position: Item # 6 SOLD: 300 HLP-UN:CA at C$14.17 (realized gain in CADs=C$1,244.75; reportable U.S. Profit Gain=$1,039.15).   

SA Instablog Published on BDGE's Third Quarter Report

After reviewing Bridge Bancorp's third quarter report this morning, I decided to publish an SA Instablog discussing the positive metrics in this report. 


That blog is similar to the earlier one discussing WTBA:


I am focusing on what I like to see in these reports. 

Without checking, I think there is just one bank in my regional bank basket, the ultra conservative and cautious Merchant's Bancshares (MBVT) who has or will report lower NPL and NPA ratios:


I had discussed that report in the regional bank update that was deleted by Google's out-of-control blogger software when I attempted to open the draft blog.

The is an excerpt of MBVT's NPL and NPA ratios as of 9/30/14. An investor is unlikely to find another publicly traded bank with lower numbers. 


Friday, October 24, 2014

BOUGHT 50 NGHCP at $24.3/Sold 50 AMNB at $23.03/Bought 100 PNNT at $10.66-Regular IRA/Bought Back PWCDF at $25.81/Bought 50 PSEC at $9.65-Roth IRA

Housekeeping: There will be no monthly update of the basket strategies. Google deleted that post today when I attempted to open it. Google Just Deleted My Monthly Update for the Basket Strategies-THERE WILL BE NO UPDATE THIS MONTH

I did discuss one Lottery Ticket purchase made over the past month in a SA Instablog: Lottery Ticket Basket Strategy-Bought 40 CORR At $7 - South Gent | Seeking Alpha

I also discussed one small addition to the regional bank basket at that site: Regional Bank Basket Strategy: Added 50 ONB At $12.45 - South Gent | Seeking Alpha

Google remains unable to take visitors to my blog who are using the correct blog URL. I have quit using it to gain access. Instead, I will bookmark the "blog archive" for the latest month. Stocks, Bonds & Politics: October 2014

I am now on an irregular publication schedule. Some trades will be discussed here and some individual trades will be discussed at SA.

Big Picture Synopsis 

Stocks:
Stable Vix Pattern (Bullish)(Requires a Trigger Event To End)                   
Short Term: Market Needs to Correct 10% to 15%               
Intermediate Term: Slightly Bullish (gains to date borrow from the future)
Long Term: Bullish

The VIX remains in a Stable Vix Pattern. The brief spike to the mid-20s was insufficient to generate a Trigger Event under the Model.

Close on October 24, 2014 VIX: 16.11 -0.42 (-2.54%)

Vix Asset Allocation Model - South Gent | Seeking Alpha

According to the S & P 500 chart, the rally today did not piece the 50 day SMA line to the upside, while that index did close above its 200 day SMA line and only traded a few days below that SMA line. Interactive Chart In several recent SA comments, I mentioned that the S & P 500 break below the 200 day SMA line was not a good sell indicator. I would want to see a close lower than 5% below that line and a Trigger Event in my Vix Asset Allocation Model.

Bonds:               
Short to Long Term: Slight Bearish Based on Interest Rate Normalization
The Difficult Path to Interest Rate Normalization


The 10 year TIP break-even spread closed today at 1.9% and has been trending down.

That forecast is known as the break-even spread, the average annual rate of inflation for the owner of the 10 year TIP to break even with the owner of the non-inflation protected treasury.

The break-even spread is calculated by subtracting the yield of the TIP
Daily Treasury Real Yield Curve Rates

From the Yield of the Non-inflation protected treasury
Daily Treasury Yield Curve Rates

A persistently low inflation rate is a predicate condition for a long term secular bull market in stocks.

For the 12 month period ending in September, the government reported that CPI rose at a non-seasonally adjusted rate of 1.7%  Consumer Price Index Summary

I do not believe that my Blue Cross health insurance premium increase for 2015 is included in that number. I did a mental calculation, always a hazard for an OG, and came up with 18+%.


***************

1. Bought 50 NGHCP at $24.3 (see Disclaimer):


Snapshot of Trade:


Security Description: National General Holdings Corp. 7.5% Pfd. Series A (NGHCP) is a new non-cumulative equity preferred stock that pays qualified dividends at the fixed coupon rate of 7.5%  on a $25 par value. The issuer, National General Holdings (NGHC), has the option to redeem the issue on or after 7/15/2019. This preferred stock will be perpetual until the issuer elects to redeem it. The issuer may redeem on or after 7/15/2019 when it is in its interest to do so.

Prospectus

The prospectus contains a typical Dividend Stopper Clause, the legal mechanism for enforcing the preferred shareholders superior rights to common shareholders:

Dividend Stopper Clause

Company Description: National General Holdings was formed in 2009 and is a speciality personal lines insurance holding company.  Profile

The company reported second quarter net income of $30.3M or $.32 per share up from $13.1M or $.22 per share in the 2013 second quarter.

National General Website

Investor Relations - National General

Key Developments Page at Reuters

The consensus E.P.S. estimate is fo $1.18 in 2014 and $1.59 in 2015. NGHC Analyst Estimates

NGHC 2014 2Q 10-Q

NGHC 2013 10K (risks discussed starting at page 25)

Rational: This security generates a yield of about 7.72% at a total cost of $24.3 per share. The dividends are qualified so that yield is tax favored in a taxable account when the taxpayer has a marginal rate in excess of 15% and a 15% cap on qualified dividends. Taxes on Income and Capital Gains for 2014

The after tax rate of approximately 6.56%, assuming a 15% tax rate, is significantly above the current rate of inflation.

The general idea is to harvest several quarterly dividends and to escape with a profit.

I view equity preferred stocks with some disfavor for the reasons outlined throughout this blog for the past 6 years and in the following section.


Risks: The company discusses risks incident to its operations starting at page 18 of the prospectus. One of the risks mentioned is phrased this way: "Our principal stockholders have the ability to control our business, which may be disadvantageous to other stockholders".

There are a number of investors who have issues with the principal stockholders. This preferred stock is selling at an unusually yield that may be due to what I would call the Michael Karfunkel discount.

Mr. Karfunkel is an elderly gentleman who co-founded the American Stock Transfer and Trust Company in 1971, a stock transfer company, that was sold in 2008.  He is a founder and Chairman of the Board of Amtrust (AFSI) and is also a founder of Maiden. It is the AmTrust connection that makes some queasy as I previously mentioned when buying 50 shares of its preferred stock. Item # 7 Bought 50 AFSIPRB at $24.79

National General started to pay a quarterly dividend of $.01 per share in the 2013 4th quarter. NGHC Dividend Date & History If that cash dividend is eliminated, there is no legal impediment to eliminating the non-cumulative preferred stock dividend. An elimination of that common dividend would likely cause the preferred stock to crater in price in my opinion. Why would a company eliminate a 1 cent per quarter dividend? The dividend stopper clause does prevent National General from eliminating the preferred dividend for as long as it maintains a cash dividend payment to the common shareholders.

The lowly status of equity preferred stocks makes them subject to severe downdrafts in price during periods of market turmoil and financial stress. Many of the non-cumulative preferred stocks crashed in 2008, falling in many cases to the single digits, even when the issuer kept paying the dividends. The most recent severe decline occurred during the 2011 stock market correction. I noted in a August 2011 post a really bad day for several different types of exchange traded securities, having a higher priority than common stock in the capital structure. Item # 1 Fear and Enhanced Volatility in Certain Classes of Income Securities

I lump equity preferred stocks with bonds since their bond characteristics are more dominant than their equity features. Many of their equity features are undesirable including their potential perpetual terms without actually having an equity interest in the business and with interest rate risk being asymmetric with the issuer. I view equity preferred stocks as a disfavored asset class and will consequently attempt to trade them opportunistically.

The interest rate risk is asymmetric between the issuer and the owner of the preferred stock.

If interest rates rise, the issuer will allow the owner to keep the preferred stock which is declining in value. The investor has the option to sell at a loss, or to keep the security declining in value and consequently lose the opportunity to reinvest the proceeds in a higher yielding security.

These securities can become perpetual for an individual's lifetime when rates rise and then remain at a level sufficiently high enough that it is not advantageous for the issuer to exercise their optional call right.

If interest rates decline and the issuer can refinance at lower rates, then the issuer has the option after the call date to redeem the security and to pay only par value plus accrued dividends, providing the investor with cash that can only then be reinvested in a lower yielding security.

When bought near par value, share price appreciation is minimal, while downside price risk is retained by the investor rather than the issuer, due to two factors.

First, in a declining rate environment, where the issuer is likely to redeem the security when it is legally able to do so (generally five years after the IPO), the price will be unable to rise much above par value even under optimal credit conditions for the issuer.

Second, the downside risk to the investor is not capped due to interest rates rising. In a rising rate scenario, the issuer has locked a favorable rate to its advantage, possibly into perpetuity, while the owner of the fixed coupon preferred stock has only bad choices left.

In a BK, an equity preferred stock is likely to meet the same fate as the common stock.

Future Buys/Sells:  I am always in a trading mode for equity preferred stocks. I have sold a bunch of them so far this year.

I summarized some of the REIT preferred stock dispositions in my recently published gateway post:

I have also bought and sold several equity preferred stocks this year. Stocks, Bonds & Politics: Gateway Post: Equity REIT Common and Preferred Stock Basket

See Also: Advantages and Disadvantages of Equity Preferred Floating Rate Securities (includes snapshots of profits)

Closing Price Last Friday: NGHCP: $24.30 +0.05 (+0.21%)

2. Bought 100 PNNT at $10.66-Regular IRA (see Disclaimer): 

Snapshot of Trade:


Company Description: PennantPark Investment is a BDC that invests in middle market companies, defined as companies with annual revenues between $50 to $1B. Those companies do not generally have bond ratings.

In early September 2014, PNNT announced that it wanted to sell 11 million shares. Preliminary Prospectus Supplement Perhaps, this game is becoming a bit tiresome and the BDC was only able to sell 8.5M shares at $11.63. PennantPark Investment Corporation Prices Public Offering There was a standard over allotment option.

The $11.63 price is the price paid by the public.

After underwriting fees and costs, PNNT received significantly less. SEC Filing ($11.2811 per share before $500,000 in expenses) The last reported net asset value per share was $11.33 as of 6/30/14. SEC Filed Earnings Press Release

PennantPark Investment Corporation is currently paying a quarterly dividend of $.28 per share.

Prior Trades: 

I last sold PNNT when the market price was at a premium to NAV per share, viewed as substantial for an externally managed BDC in my opinion. Item # 5 Sold 50 PNNT at $11.92 (12/17/13 Post)(profit $71.68)-Item # 6 Bought 50 PNNT at $10.2-ROTH IRA (11/21/12 Post) When I sold that 50 share lot, the last reported net asset value per share was $10.49 as of 9/30/13, so an $11.92 market price was a 13.63% premium to that NAV number.

Last Earnings Report: Prior to this last trade, the last earnings report was for the Q/E 6/30/14. SEC Filed Press Release PNNT reported core net investment income of $.28 per share and a 12.3% yield on investments at the quarter's end.

I do not find much comfort in the large weighting in second lien debt and securities lower down in the capital structure:

Click To Enlarge:
Portfolio Description

Rationale: As with all BDCs, my goal is to harvest a 10% annualized total return and will consider doing so when and if I achieve that objective. I could achieve that annualized return by collecting 4 dividends and selling the shares at a slight loss. I am not likely to sell the shares for a loss unless I become spooked about this BDC's performance.

The current quarterly dividend is $.28 per share. At a total cost of $10.66 per share, and assuming a continuation of that rate, the dividend yield would be about 10.51%.

The general idea is to harvest that yield and to escape without losing money on the shares. Easier said than done is my motto for externally managed BDCs.

By buying at below the last reported net asset value per share, I simply improve my chances of getting out with a share loss.

I placed this purchase in a regular IRA. If the shares fall by more than 10% from my purchase price, I will consider doing a Roth IRA conversion. My last IRA purchase was a 50 share lot made in a Roth IRA and sold at $11.92.

Risks: As with all BDCs, PNNT has considerable risks summarized in a very long discussion found in its F/Y 2013 Annual Report staring at page 14, Form 10-K

PNNT is not a serial issuer of common stock like PSEC which unfortunately also has a history of selling shares before net asset value per share.

BDCs invest in risky companies and do not retain much of a capital after paying dividends to their common shareholders. The shares will perform badly during a recession.

PNNT has an usually large allocation to riskier subordinated debt and a large second lien debt weighting (see above snapshot)

Loans made by BDCs are generally not rated by Moody's or S & P. If the loans were rated, most of them would be at CCC+ or lower.  An average portfolio yield of 12.3% adequately describes the risk when the ten year treasury is hovering around 2.2.%.

Future Buys and Sells: I will not buy more shares. I am full at 200 shares given my analysis of the potential rewards and risks.

I will sell the shares bought in the Regular IRA in accordance with the trading rules for externally managed BDCs. I am looking for an annualized total return in excess of the dividend yield. The goal is to harvest an annualized total return of 10% whenever that can be achieved through a combination of capital appreciation and/or dividends. I will consider selling shares whenever the market price exceeds net asset value per share by more than 5% and will consider buying share sold when and if the market price falls below net asset value per share.

Closing Price Last Friday: PNNT: $10.65 +0.03 (+0.28%)

3. Bought Back 100 PWCDF at $25.81 (see Disclaimer):  This trade is discussed in a recent SeekingAlpha Instablog.

Bought Back Power Corporation Of Canada at $25.81 (PWCDF) - South Gent | Seeking Alpha

Item # 5 Sold 100 PWCDF at $28.83 (8/2/14 Post)-Item # 4 Bought 100 PWCDF at $27.29 (7/12/14 Post)

Closing Price on Friday PWCDF: $25.97 +0.16 (+0.61%)

4. Bought 50 PSEC at $9.65-Roth IRA (see Disclaimer): Let me be clear in case anyone has not yet gotten the message. I do not like this company. I only like its current dividend.

Possibly, I do not have the same disdain that was evident in this SA Instablog discussing the many problems of externally managed BDCs.: Added 50 AINV At $7.94 - South Gent | Seeking Alpha

Snapshot of Trade:

2014 PSEC Bought 50 at $9.65-Roth IRA
This purchase was at a 9.64% discount to PSEC's last reported net asset value per share of $10.68 as of 6/30/14.

Company Description: PSEC is an externally managed BDC.

PSEC Interactive Chart

Annualized Total Return 7/27/2004 through 10/23/14:  6.13%, Calculator

That return is with dividend reinvestment.

PSEC has a bad history of selling stock at below net asset value per share. Seeking Alpha

Net Asset Value Per Share Destruction: The last reported net asset value per share was $10.68.  PSEC 10-Q Q3 2014

Sourced from PSEC's 10-Q Filings

6/30/2014:  $10.68 AUM $6.006+ Billion
9/30/11: 10.41 AUM=$1.652+Billion
9/30/09  $11.11
6/30/09 $12.4
3/31/08: $14.15 10q
6/30/07: $15.04
6/31/06 $15.31

Prior Trades: I have traded down to just a few shares in a taxable account.

PSEC 74+ Shares Average Cost Per Share  $9.46

With this 50 share purchase, I am just nibbling, replacing for now only 50 of the 100 shares sold in the Roth IRA a few weeks ago. Sold Roth IRA: 100 PSEC at $10.65 (9/6/14 Post) I accomplished my objective, escaping with a profit (+$30.99) after harvesting $230.67 in dividends. Bought 100 PSEC @ $10.2-Roth IRA (11/16/12 Post) So now I have reset my average cost at a lower number than the previous buy in November 2012 ($9.65 vs. $10.2, so my yield goes up and I have a better chance of escaping with a profit).

Rationale: The rationale starts and stops with the dividend. PSEC increasing the dividend by a minuscule amount each month since it slashed the dividend back in 2010, when it went from a $.41 quarterly rate to a $.10 monthly rate. PSEC Dividend Date & History For ease of computation, I will just call it a $.11 monthly rate. That produces about a 13.68% percent yield at a total cost per share of $9.65, which is tax free in the Roth IRA. Assuming I can escape with a loss on the shares, easier said than done, money will double in about at a tax free rate of 13.68%.

Risks: I have discussed the risks until I am no longer willing to repeat them. They can be found in prior PSEC posts here and at SA (South Gent's Comments on PSEC: Prospect Capital Corporation | Seeking Alpha)

I also discuss risks relating to externally managed BDC's in three recent SA Instablogs:

New Mountain Finance Share Offering Today Illustrates Multiple Risks Inherent In BDC Stocks - South Gent | Seeking Alpha

Added 50 AINV At $7.94 - South Gent | Seeking Alpha

Bought 50 ARCC At $15.41-A Typical Small Lot Purchase Of An Externally Managed BDC Stock - South Gent | Seeking Alpha

Extensive risk discussion can be found in PSEC's Annual Reports filed with the SEC.

Friday Closing Price: PSEC: $9.74 +0.10 (+1.04%)


5. Sold 50 AMNB at $23.03 (REGIONAL BANK BASKET STRATEGY)(see Disclaimer): 

My discussion of this sell was deleted by Google and was part of my regional bank update.

I am not going to rewrite it.

While this bank had several positive metrics in its last earnings report, the E.P.S. downtrend is viewed unfavorably. I may consider buying shares back at below $21. For now, I decided to chuck it.

American National Bankshares Inc. Reports Third Quarter 2014 Earnings

Snapshot of Trade:


Snapshot of Profit:

2014 Sold 50 AMNB +$77.57

Bought 50 AMNB at $21.16 (9/7/13 Post)

Closing Price on Friday: AMNB: $22.83 -0.16 (-0.70%)


Bought Back 100 PWCDF at $25.81

I just published a SA Instablog discussing the repurchase of Power Corporation of Canada made yesterday. I discuss buying the shares on the pink sheet exchange using USDs. I am not discussing the near simultaneous purchase of the ordinary shares trading in Toronto using CADs. 

Google Just Deleted My Monthly Update for the Basket Strategies-THERE WILL BE NO UPDATE THIS MONTH

I attempted a moment ago to open for editing my monthly update for the Lottery Ticket, Regional Bank and REIT Baskets. I clicked the link, as I have have always done, and Google deleted the blog rather than opening it.  Within one second after clicking the link to open the draft, Google simultaneously deleted it and then saved a blank post in its place: 

Snapshot of What Was Left Within One Second After Clicking to Open-Nothing But White Space

There will consequently be no update this month for those basket strategies. 

Given the extreme level of dysfunction now present with Google's Blogger site, I am partly to blame for failing to save my work product on my computer. 

I am consequently posting more at the SeekingAlpha Instablog website. South Gent's Instablog | Seeking Alpha


Google is still unable to connect readers to my blog using the correct URL. I have quit using the blog URL to gain access. 

Instead I will use a link to a particular or a link to the most current month's archive: Stocks, Bonds & Politics: October 2014

SA Instablog Published on WTBA Earnings Report Released Today

Thursday, October 23, 2014

SA Instablog Published On New Mountain's Share Offering Today/ SOLD 100 of 150 NMFC at $14.4773

New Mountain Finance Share Offering Today Illustrates Multiple Risks Inherent In BDC Stocks - South Gent | Seeking Alpha

Added 10/23/14: In that post, I discuss NMFC's writedown of a PIK first lien loan made to a company called UniTek Global Services, who agreed to a prepackaged bankruptcy filing with its lenders. In UniTek's press release, the agreement is generally described as more than a 40% swap of bonds for equity. UniTek Global Services

TICC Capital (TICC) listed a UniTek "tranche B term loan" in the principal amount of $11,781,583 and valued by TICC at $11,781,583 as of 6/30/14:

Page 4 10-Q for the Q/E 6/30/14

Apollo Investment is providing 1/2 of the debtor-in-possession financing, according to an article published by The Deal Pipeline (a subscription publication that provided a free preview through a Yahoo Finance link at UNTK.

Main Street Capital (MAIN) also listed a loan to UniTek in its last SEC Form 10-Q, valuing the loan in excess of its principal amount at that time:


10-Q Filing at page 21 I am surprised to see that BDC participate in this loan.

Among the BDC's that I own, NMFC had the largest exposure to UniTek.  NMFC's investment was written down as noted in a 10/22/14 filing, 8-k, and a new NAV estimate was required as a predicate for NMFC's  stock offering of 5 million shares priced at $14.53 to the public: New Mountain Finance Corporation Announces Pricing of 5,000,000 Shares of Common Stock The net proceeds to NMFC were $14.35 before expenses. Prospectus

NAV Per Share as of 6/30/14: $14.65 10-Q

NAV Per Share Estimate as of 10/22/14: $14.35 8-K

Net Proceeds after Underwriters' Discount: $14.35

Added 10/24/14: 

I was not please with NMFC's large investment in UniTek or the issuance of stock just after NMFC wrote down that investment.

As noted in my SA Instablog article, I was then down to 150 shares.

I elected to sell 100 of the 150 remaining shares this morning. I escaped with a minuscule profit and harvested 7 quarterly dividend payments. That is actually viewed as a success for an externally managed BDC.


Snapshot of Trade:


Snapshot of Profit: 

2014 NMFC 100 Shares +$3.79


Snapshot of Dividend Payments:  

2014:


2013:

Total Dividends: $185.55

Total Return: $189.34

% Return on $1,435.95 Total Cost= +13.19% (holding period 16+ months) 

SA Instablog Published: Added 100 LXP at $10.43

I published another SA Instablog discussing a purchase yesterday of 100 LXP:


Wednesday, October 22, 2014

Published Another Instablog at SeekingAlpha: IRA Buy of 50 AINV at $7.94

I published another article today at SeekingAlpha, a rewrite of the material deleted by Google in my recent AINV discussion, Added 50 BWG at $17.01/Added 100 APTS at $8.29/Bought 50 AINV at $7.94-Roth IRA/Sold 361+BTZ at $13.45-Taxable Account


Link to More Comprehensive SA Discussion: Added 50 AINV At $7.94 - southgent1951 | Seeking Alpha

SeekingAlpha Article Published on Why I Will Aggregate MY LXP Position Solely in a Fidelity Roth IRA

I published another SA article today giving a detailed Left Brain discussion of why I will aggregate my LXP position in a Fidelity Roth IRA account.  

SeekingAlpha Instablog Published Discussing Purchase of 100 APTS at $8.29

As noted in my post published last night, Google kept deleting sections of a draft blog and had gone haywire in other ways. Added 50 BWG at $17.01/Added 100 APTS at $8.29/Bought 50 AINV at $7.94-Roth IRA/Sold 361+BTZ at $13.45-Taxable Account

I elected to publish that blog even with entire sections no longer available, though they were written and saved by me. 

Instead of fooling with Google's Blogger service, I elected to publish to rewrite and publish today a discussion of the 100 APTS add.  

Tuesday, October 21, 2014

Added 50 BWG at $17.01/Added 100 APTS at $8.29/Bought 50 AINV at $7.94-Roth IRA/Sold 361+BTZ at $13.45-Taxable Account

I am having yet a another new problem with Google's Blogger website. When writing this post, I receive this message every few seconds:


I have not logged out from another location. If I click the phrase "Yes, I want to log in again", then I log in again, and then I will receive the same message again within a few seconds. To write this blog, I have to click close and then try to type a few words before I have to hit close again.

I found that Google was not saving most of the what I was writing, which would disappear when I opened the blog back up even after managing to save the work product. Google was destroying my work product making it impossible for me to make changes. 


Google improved in its ability to keep material after I published the post for the first time, which has allowed me to make some additions, like the one I am typing now.  The text in bold red lettering was added after this post was first published which apparently resolved Google's problem. 

Needless to say, this is most annoying and caused me to quit writing this blog, and to go ahead and publish it even though it had entire sections missing.

Google's Blogger service has reached a highly dysfunctional state. 

The same is true for Google's email service. Last night I received an email saying that some one had my password and Google has blocked access to my Gmail account. As far as I can tell after investigating this claim, Google blocked my attempt to access the account from the computer that I always use to access the account.

I was not allowed to log into my account later this evening due to my "account settings" being out of date. I logged back into the account and was taken to the account settings page. After that happened , I clicked the tab "advanced sync settings" and then clicked OK which seemed to solve the problem at least for now. What the heck?

To access the blog most of the time, the blog URL does not work. Typically there will be a delay followed by a message that the site is unavailable. Google has simply lost the ability to connect to my blog using the blog URL.

I may start writing more posts for publication at SeekingAlpha.

Big Picture Synopsis 

Stocks:
Stable Vix Pattern (Bullish)(Requires a Trigger Event To End)                   
Short Term: Market Needs to Correct 10% to 15%               
Intermediate Term: Slightly Bullish (gains to date borrow from the future)
Long Term: Bullish


Bonds:               
Short to Long Term: Slight Bearish Based on Interest Rate Normalization
The Difficult Path to Interest Rate Normalization

That forecast is known as the break-even spread, the average annual rate of inflation for the owner of the 10 year TIP to break even with the owner of the non-inflation protected treasury.

The break-even spread is calculated by subtracting the yield of the TIP
Daily Treasury Real Yield Curve Rates

From the Yield of the Non-inflation protected treasury
Daily Treasury Yield Curve Rates


***************

Recent Developments:

China's GDP grew at 7.3% during the third quarter, the slowest rate in five years. CBS News

Existing single family home sales increased at a 2.4% seasonally adjusted annual rate in September. Sales reached their highest pace so far this year, but are still 1.7% below the annualized rate from September 2013.  Existing-Home Sales Rebound in September | realtor.org


******************
Omega HealthCare (OHI): 

OHI raised its quarterly dividend by 1 cent per share to $.52 per share: Omega Announces Ninth Consecutive Increase in Common Stock Dividend

In a Seeking Alpha article published last week, Brad Thomas discusses this dividend increase in the context of improving fundamentals.

I own 100 shares as part of  my Equity REIT Common and Preferred Stock Basket.

Item # 2 Bought: 100 OHI at $29.85 (12/23/13 Post)

At the new quarterly rate, the dividend yield would be about 6.97% at a total cost per share of $29.85.

*********************

1. Added 50 BWG at $17.01 (see Disclaimer):

Snapshot of Trade:

2014 Added 50 BWG at $17.01

Snapshot of Quote Before Trade:


Snapshot of Data Day Before Trade 10/15/14


Security Description: The Legg Mason BW Global Income Opportunities Fund (BWG) is a leveraged bond CEF that invests globally.

Data From Date of Trade:
Closing Net Asset Value Per Share: $19.85
Closing Market Price: $17.07
Discount -14.01%
Average Discount 1 Year= -12.97%

CEFConnect Page for BWG

I suspect that the sharp decline between October 15 to 16 was due to the fund's heavy exposure to certain sovereign debt securities including the 2037 Portugal bond.  Net asset value per share declined from $20.11 (10/15/14) to $19.85 (10/16/14), but then rebounded to $20.11 on 10/17/14. That tells me something about this fund. The ride will be volatile.

SEC Form N-Q Holdings as of 7/31/14: Legg Mason BW Global Income Opportunities Fund (unrealized gains $5.797M; as noted in that report, the fund does some currency hedging)

Last SEC Filed Shareholder Report-Period Ending 4/30/14: LM BW Global Income Opportunities Fund

Sponsor's Website: Individual Investor (portfolio characteristics as of 6/30/14: effective duration 8.92 Years)

Dividends: BWG is a relatively new bond CEF which started operations back in 2012. The fund started out paying a monthly distribution of $.12 per share, raised that to $.125 per share effective for the June 2014 distribution, and increased the rate to $.13 effective for the September dividend. The fund also paid a capital gain distribution of $.42 per share back in December 2013. CEF Details Distributions|

Morningstar calculates the total return at 13.76% YTD and 10.99% over 1 year through 10/15/14 based on net asset value. There is a material difference when calculating the YTD return based on market price which was 7.75%. That significant disparity between total returns based on net asset value and market price indicates that the market price change has not kept up with the increase in the total return based on net asset value per share. The difference in values is manifested in an increase in the discount to net asset, one of the many known risks and potential benefits associated with bond CEFs.

The credit quality is weighted in investment grade bonds, but the fund has substantial exposure to BB and B junk rated bonds.


Prior Trade: There is a saying that is more than cliche. If you find yourself in a hole, stop digging. That rule is sometimes referred to as THE FIRST LAW of HOLEs.

I am in a hole with BWG, and I am still digging.

My last purchase was at $17.75.

Rationale: The primary reason for investing in any bond CEF is to generate income hopefully without incurring a loss on the shares-another one of those easier said than done predicaments.

Short term borrowing costs for a leveraged bond fund are at abnormally low levels now and for the past six years due to the FED's ZIRP monetary policy. The fund can borrow short term and use those borrowed funds to buy higher yielding longer term bonds, capturing the yield differential that juices the current dividend payments to the fund's owners who are either smart or stupid, or something in between for accepting the leverage risk for a little more current income.

Considering our low yield world, and the lowering of inflation expectations throughout the developed world and even in several emerging markets, the current yield, which is not yet supported by a ROC, is about 9.17% at a total cost of $17.01 per share.  Risks are frequently commensurate with yield. But there are all kinds of risks. One risk is that the investments will not generate a sufficient total return to accomplish an investor's objectives.

Only the very rich can plow their savings into a ten year German government bond yielding .9%, or a ten year TIP with less than a .5% current yield. Daily Treasury Real Yield Curve Rates; DE 10Y Govt Bond Benchmark Bond

I comprehended that risk a long time ago, maybe around 1975 or so, that I would generally describe as the risk of falling short, possibly way short. This is not to say that I will take foolish risks, like investing in internet bubble stocks in 1999, but I needed to take risks to reach the point where I am now.

Risks: (1) Leverage and Bond Value Risks: What is the disaster for the leveraged bond CEF owner? It involves the infamous triple whammy.  Borrowing costs rise as short term rates start to go up while a rise in intermediate and longer term rates cause the value of owned bonds to fall in price, including those bought with borrowed money. The confluence of those two events sends the individual investors who are the predominant owners of these funds scurrying for the exists, buyers disappear, and the discount to net asset value increases as the dividend is cut, bond losses pile up and the net asset value per share declines-not a pretty picture for those who do not know that bonds can actually be in a long term bear market.

The last long term bear market started around 1950 and lasted until 1982. This is a link to a chart that highlights the devastation: CHART

At first, it was like suffering a thousand paper cuts before the coup d'grace was administered in the late 1970s and early 1980s. There was an adage at the time that went something like this: "How do you become a millionaire trading bonds, start out with $2 Million".

(2) Currency Risks:


Any foreign security owned by a fund priced in USDs is going to have this significant risk which can also turn into a benefit when the foreign currencies gain in value against the USD. Recently, several foreign currencies have been declining in value which flows through into the value of the fund's holdings, at least to the extent the currency decline is not hedged and that hedging can cost money too. Maybe the fund makes money on its hedges when the USD is rising in value and then loses money when the USD is falling. Hedging by a fund is not a one way street unless a market timing gift is bestow by the Lord on the fund managers.

Future Buys/Sells: I may average down with 50 share lots. I will definitely sell some of the higher cost shares whenever I have a profit. I can wait. Unadjusted for dividends, including the 2013 capital gain distribution, the price was over $21 back in May 2013: BWG Interactive Chart The rise in rates in the U.S. starting in May 2013 had a widespread negative impact on international bonds, both in terms of price and currency. On 5/1/13, the net asset value per share was $22.97 and the discount was -7.58 based on a close that day at $21.23.


3. Bought 100 APTS at $8.29-Averaged Down (Equity REIT Common and Preferred Stock Basket)(see Disclaimer)

Snapshot of Trade:


Company Description: Preferred Apartment Communities (APTS) is a relatively new REIT primarily focused on apartments with the intention of growing its retail assets to 20% of the total.

I repeatedly lost part of my discussion about recent developments, so I gave up trying to type any extensive discussion of these important developments.

Hopefully, Google will not eliminate the following links that disclose the acquisition of 6 grocery shopping centers and 4 apartment complexes, along with the financing arrangements for those acquisitions. I spent about twenty minutes earlier in the evening typing a description, but Google has lost it twice now:

Press_Release_-_Sunbelt_6_Acquisition

Press_Release_-_Acquisition_of_Dunbar

Key Developments Page at Reuters

APTS is currently paying a quarterly dividend of $.16 per share. Preferred Apartment Communities, Inc. Announces Third Quarter 2014 Common Stock Dividend Assuming a continuation of that rate, the dividend yield at a total cost of $8.29 is about 7.72%.

Since its IPO in 2011, APTs has raised its quarterly dividend several times, starting with a $.125 dividend rate in 2011. (APTS) Dividend Date & History

I left one mostly meaningless comment to a recent Seeking Alpha article on this REIT. I just wanted to point out that the apartment complex that APTs was acquiring in "Nashville" was in Gallatin, TN.

Last Earnings Report: Due to the recently announced proposed acquisitions, the company as configured, prior to the closings of those acquisitions, is not that important or predictive of future results.

Preferred Apartment Communities reported second quarter FFO of $4.091+M or $.25 per share. Normalized funds from operations was given at $.26 per share. AFFO was reported at $.21 per share. Same store rental revenues rose 4.3% during the quarter compared to the second quarter of 2013, while NOI increased by 6.99% on the same basis.

For apartments, the company discussed acquiring 1,397 apartment units in four geographic areas that it describes as Nashville, Kansas City, Dallas, and Houston. The total purchase price is $181.7M which is a huge bite for such a small REIT. That acquisition cost is higher than the current market cap.  I noted in a comment to a recent SA article that it is a bit of a stretch to call the "Nashville" acquisition as being in Nashville. As I mentioned in my comment to the SA article reference above, this apartment complex is near Nashville and may be inside what some would call the greater Nashville metropolitan market, but the address is 2325 Nashville Pike, Gallatin, TN. 37066. (see article about this acquisition in Multi-Housing News Online) That complex has 364 apartments and is located on 30.5 acres. It looks nice.

Google Map Showing Location of "Nashville" Apartment Complex: Stoneridge Farms-Google Maps

Another apartment complex is near "Houston", but is actually located in Katy, Tx.: Vineyards Apartments - Google Maps;  Katy,TX | Vineyards Apartments

The two other apartment complexes appear to be:

Estancia Townhomes in Dallas- Google Maps

Sandstone Creek-Google Maps (just outside of Kansas City); Overland Park, KS-Sandstone Creek Apartments

 Rationale:  

At the current quarterly rate, the dividend yield is about 7.72% at a total cost of $8.29.

An article published in Seeking Alpha back in August contained a chart estimating the market value per share of REIT apartment properties. The estimate then was $10.69 per share. I have no opinion on that valuation, and simply offer it for whatever it may be worth, if anything. The article does contain a good discussion about the supply/demand factors for Apartment REITs.

Risks: One substantial risk involves all of the recently announced acquisitions. Those acquisitions will more than double the REIT's size and will have to be financed successfully. Whenever a company grows this fast, there is always some danger that it will grow too fast or grow too much at the wrong time.

Future Buys/Sells: I may average down in 50 shares lots, but I doubt that more than 50 more shares will be purchased in the IRA due to risk considerations. There could be a downdraft when APTS announces a share offering to help for the previously discussed acquisitions.

4. Sold 361+ BTZ at $13.45 Taxable Account (see Disclaimer):

Snapshot of Trade:


Snapshot of Profit:

2014 Sold 361+ BTZ shares +$116.91

I can not find the links to all of those purchases. Some of the shares were acquired when another Blackrock bond CEF merged into BTZ. Item # 3 Added 50 BTZ at $12.35 (8/31/13 Post)Item # 4 Added 70 BTZ at $12.63 (7/13/13 Post)

Security Description: The BlackRock Credit Allocation Income Trust (BTZ) is a closed end leveraged bond fund that is weighted in investment grade bonds.

I am transferring this position to the Roth IRA. Item # 2 Added 100 BTZ at $13.47-ROTH IRA (9/20/14)Item # 8 Bought 100 BTZ at $13.7-Roth IRA (7/26/14 Post);

Sponsor's Website: Credit Allocation Income Trust | BTZ (number of holdings as of 6/30/14=573; effective duration shown at 5.64 years-Get to know your bond fund: Duration| Vanguard)

Last SEC Filed Shareholder Repot: BLACKROCK CREDIT ALLOCATION INCOME TRUST

Last SEC Filed N-Q: BLACKROCK CREDIT ALLOCATION INCOME TRUST (holdings as of 7/31/14)

Data as of Date of Trade 10/17/14
Closing Net Asset Value Per Share: $15.36
Closing Market Price: $13.39
Discount: -12.83%

CEFConnect Page for BTZ

2014 Second Factsheet.pdf

The fund sponsor has a new website that easier to navigate and prettier than the old one. That site has more up to date information:


The current monthly dividend rate is $.085 per share or $.966 annually. I did own the shares when BTZ went ex dividend on 10/10.

Prior Trades: I do not recall doing it, but apparently I sold some BTZ shares held in a regular IRA earlier this year. Item # 8 Sold IRA: 210+BTZ at $13.62 (3/17/14 Post) One reason for writing this blog is simply to keep track of what I am doing, since I am increasing forgetting what I have done or what I am supposed to do. I noted in that post that those regular IRA shares were sold as part of the transition to shares being owned entirely in a Roth IRA account.

A purchase made within the past year is discussed in the following posts: Item # 3 Added 50 BTZ at $12.35 (8/31/13 Post)(discount then at -14.87%). In that post, I have some snapshots of prior trading profits totaling $413.80. 

Another recent purchase was discussed in this post: Item # 4 Added 70 BTZ at $12.63 (7/13/13 Post)(discount then -13.57%)

Rationale: I am simply transitioning this position to the ROTH IRA, as previously noted in earlier blogs. Since this fund collects interest payments from its bond positions, the dividends paid to its shareholders take on that same non-favored tax status and would be taxed at my highest marginal rate when paid into a taxable account. Dividends paid into my ROTH IRA are not taxable when paid or withdrawn under current law with a very limited exception that is not applicable to my situation. I in effect turn the BTZ taxable "interest" payments into tax free distributions in the Roth.

Future Buys: I will gradually build my IRA BTZ position to 300 shares, buying only when the purchase will lower my current average cost per share in that account.

5. Bought 50 AINV at $7.94 Roth IRA (see Disclaimer): 

I lost a great deal of my discussions involving this purchase and the one noted in Item # 5.  I saved the material, but it disappeared nonetheless. I will try to expand my discussion of AINV by writing a SA Instablog tomorrow. I can not spend anymore time typing and re-typing at Google's Blogger site.  

Snapshot of Trade:


Company Description Apollo Investment (AINV) is one of the largest and oldest BDCs.

Sponsor's website: Apollo Investment Corporation

Apollo Investment Corporation Portfolio

Prior to the Near Depression, AINV stock traded over $23 in 2007 and then made a swan dive into the low single digits which simply highlights the risks. AINV Interactive Chart Since August 2011, the stock has moved mostly in a narrow channel between $6.5-$9.

AINV was paying a quarterly dividend of $.52 per share in 2008 and then slashed it $.26 effective for the 2009 first quarter. The dividend was slashed again to $.2 in the 2012 first quarter and has thereafter remained at that level. Apollo Investment Corporation (AINV) Dividend History Needless to say, I view that dividend history most unfavorably.

Let me emphasize the potential loss by summarizing some historical net asset values per share data.

Data Taken From  AINV 10-Q Filings

6/30/2007: $19.09 Form 10-Q
3/31/09: $9.82 Form 10-Q
6/30/2011: $9.76 Form 10-Q
6/30/12: $8.3 Form 10-Q
6/30/2013: $8.16 10-Q
3/31/14: $8.67
6/30/14: $8.74 AINV-2014.6.30-10Q

Talent? Competence? Incentive Fees for incinerating money?

I would emphasize that these Masters of the Universe are being paid 2% of total assets plus an incentive fees for this performance. (page 79, AINV-2014.3.31-10KBDC Fees: Seeking Alpha)

Given my disdain for externally managed BDCs, which I view as amply supported by their history, I am content to harvest their dividends and to escape with whatever profit is possible.

Last  February, Apollo sold 12M shares at 8.69. The net asset value per share was reported at $8.67 per share as of 3/31/14. 

Prior Trades: I am buying back 50 of the 155+ shares sold a few weeks ago. Sold 155+ AINV at $8.81-ROTH IRA (8/20/14 Post)-Bought Roth IRA: 100 AINV at $8.68 I averaged down soon after that purchase at $8.68 by buying a 50 share lot at $8.06, as shown in the snapshot discussing the sell of that shares.

I currently own 100 shares in a taxable account. Bought: 100 AINV at $7.95 (5/10/14 Post)

Apollo Investment SEC Filings

Link to Upbeat Seeking Alpha published in August.

Related Trade: I still own 50 shares of Apollo's exchange traded senior bond:  Bought Roth IRA: 50 AIY at $24 (4/5/14 Post)

Quote: Apollo Investment Corp. 6.875% Senior Notes due 2043 (AIY)

Last Earnings Report: My discussion of the earnings report, rationale and risks continues to be deleted and I have given up trying to write it again. This picture survived Google's malfunctions. 


Q1 2015 Results - Earnings Call Transcript | Seeking Alpha

Rational And Risks:

Future Buys and Sells: I have AINV on a very short leash. While the recent history does now show net asset value destruction, there was an annihilation between 2007-2010.

6 Added 50 IF at $9.29 (see Disclaimer): 

Snapshot of Trade:


Security Description: The Aberdeen Indonesia Fund (IF) is a small and unleveraged closed end fund that invest in Indonesia's stocks.

Data from Day of Trade: 10/21/14
Closing Net Asset Value Per Share: $$10.35 
Closing Market Price: $9.26 
Discount: - 10.53%
1 Year Average Discount: - 10.53%
3 Year Average Discount: - 9.95%
5 Year Average Discount: - 9.17%

CEFConnect for IF

Last SEC Filed Shareholder Report (period ending 6/30/14; net unrealized appreciation $32.633+M on net assets of $100.52+M)

Factsheet as of 8/31/14

Indonesia just elected a new President, Joko Widodo, who claims to be a reformer.  CNBC When he was elected in July, Indonesia's stock index surged to 1-year.

Recent Distributions:  

Aberdeen Indonesia Fund, Inc. (IF) Dividend History

In 2013, I received two dividend payments amounting to $1.42018 per share. Tax Information I owned then 100 shares. Of that amount the fund classified $1.32227 per share as long term capital gains. The ordinary dividends were classified as qualified and represented the remainder of those distributions. I would not expect much in annual ordinary income dividends.

Another distribution of $.1099 per share was just paid and represented almost entirely long term capital gains.

10 Year Annualized Total Returns to 10/20/14: 16.14% (based on net asset value)

The past 1 and three years have been far more subdued: 2.12% for 1 year and 5.47% for 3 years.


Aberdeen Indonesia Fund Page at Morningstar (currently unrated)

JKSE Index Index Chart (Jakarta index was trading below its 50 and above its 200 day SMA at the time of purchase)

Prior Trades: 

My last purchase was back in June 2014: Item # 3 Bought: 50 IF at 9.73 (6/7/14 Post). Besides reinvested dividends, I also currently own the shares bought at $11.23

I have sold only some shares bought in 2013: Item # 5 Sold 100 IF at $12.91 (April 2013)(snapshot of profit=$110.77)-Item # 1 Bought 100 of IF at $11.64 (1/3/13 Post)
CEFConnect for IF  

Prior Trades:  Prior to this trade, I owned 114+ shares. Bought Back IF at $11.23

Item # 5 Sold 100 IF at $12.91 (April 2013)(snapshot of profit=$110.77)-Item #1 Bought 100 of IF at $11.64 (1/3/13 Post)

Rationale: Again, I am playing a long term super cycle involving the parabolic growth of middle class consumers in emerging markets. Indonesia is just one of those markets. This fund has generated an excellent annualized total return over the past 10 years. The past may not be prologue but I believe that Indonesia has better days ahead of it.

"New Indonesian Consumer Class of 2020" Nielson Publication (middle class on track to represent 52% of the total population by 2020)(March 2014)


Risks: There are numerous risks associated with a CEF that invests in stocks from one foreign country. Currency risk was highlighted recently, starting last May, when a spike in U.S. interest rates caused a significant decline in EM currencies, stocks and bonds. Emerging markets can be quite volatile, and can be positively correlated with downside moves in U.S. stocks with much higher betas.

Indonesia Economic Quarterly, July 2014: Hard Choices-World Bank