The regional bank basket strategy will be randomly updated by itself, though a minimum of 30 days will need to elapse before the next update.
I frequently use a basket approach, particularly with industry sectors, that will vary in size as to the number of components. The focus will be on the total return of the basket, rather than individual components. Some of the advantages to this approach include diversification and risk mitigation. I am not concerned about a few mishaps provided other components are doing better than I anticipated when I made the initial purchase. As noted previously, I have been surprised by some of best and worst performers in the regional bank basket.
Last Update: Update for Regional Bank Basket Strategy (9/29/14 Post)
Last Update: Update for Regional Bank Basket Strategy (9/29/14 Post)
1. Update for Regional Bank Basket Strategy:
The dividend yield showed in this table is calculated by Yahoo Finance based on last Friday's close. My dividend yield for each position will be different based on my total cost numbers. In most cases, with FNFG and VLY being notable exceptions, my dividend yield will be higher.
Dividend Yields 5% or higher: Based on Total Cost
NYCB: 8.44%
WASH: 8.34%
UBSI: 7.66%
FNLC: 5.38%
CBU: 5.15%
TRST: 5.1%
CCNE: 5.%
I am not tracking reinvested dividends in the following table. The unrealized gains per holding do not include reinvested dividends.
Realized Gains 2010 to Date: $16,675.08 (snapshots in Gateway Post)(excludes TRMK profit discussed below, waiting for broker calculation)
Dividends Received 2010 through 2013=$6,623.72
Click to Enlarge:
********
Comparison Data From the St. Louis Fed:
Net Interest Margin for all U.S. Banks
Net Interest Margin for U.S. Banks with average assets under $1B
Net Interest Margin for U.S. Banks with average assets between $1B and $15B
Return on Average Equity for all U.S. Banks (abbreviated to "ROE")
Return on Average Assets for all U.S. Banks (abbreviated to "ROA")
Nonperforming Loans (past due 90+ days plus nonaccrual) to Total Loans for all U.S. Banks (abbreviated to "NPL ratio")
Charge-Off Rate On All Loans, All Commercial Banks
Assets at Banks whose ALLL exceeds their Nonperforming Loans (I prefer a coverage ratio of over 100% at the time of my initial purchase)(ALLL=Allowance for loan losses)
New Capital Rules From the FDIC to Implement Basel III Capital Rules:

 **********
Google deleted about 15 discussions of third quarter bank earnings reports when the entire update for the three baskets was deleted by it last Friday. I subsequently discussed in more depth than usual two of those earnings reports at SA and will not rewrite the others. Regional Bank Basket Strategy: West Bancorporation Earnings Report Today - South Gent | Seeking Alpha; Regional Bank Basket Strategy: Bridge Bancorp 3rd Quarter Earnings Release - South Gent | Seeking Alpha I may discuss one more report that has not yet been released at SA.
1. First Merit (FMER): FirstMerit reported third quarter net income of $63.9M or $.37 per share, which was in line with the consensus estimate.
After selling my 100 highest cost shares, I currently own 141+ at an average cost per share of $14.52: Item # 2 Bought 30 FMER at $11.35 (August 2011); Item # 2 Added 50 FMER at $15.2 (September 2012); Item # 3 Added 50 FMER at $15.09 (February 13, 2013 Post) The foregoing purchases account for 130 of the 141+ shares with shares purchased with dividends accounting for the remainder.
I rate FMER as a hold. I am reinvesting the dividend at the moment.
FMER Interactive Chart
2 Berkshire Hills Bancorp (BHLB): Berkshire Hills reported core earnings per share of $.46 up 7% Y-O-Y:
This strategy is explained in my Gateway Post on this topic:
Snapshots of realized gains and losses can be found at the end of that post.
The dividend yield showed in this table is calculated by Yahoo Finance based on last Friday's close. My dividend yield for each position will be different based on my total cost numbers. In most cases, with FNFG and VLY being notable exceptions, my dividend yield will be higher.
Dividend Yields 5% or higher: Based on Total Cost
NYCB: 8.44%
WASH: 8.34%
UBSI: 7.66%
FNLC: 5.38%
CBU: 5.15%
TRST: 5.1%
CCNE: 5.%
I am not tracking reinvested dividends in the following table. The unrealized gains per holding do not include reinvested dividends.
Over the life of this basket strategy, I anticipate that the dividends will provide 40% to 50% of the total return. I am generally keeping my total exposure between $40,000 to $50,000.
After a number of adds, I am now over my minimum $40,000 allocation after a bout of profit taking last year.
SPDR S&P Regional Banking ETF (KRE) Total Returns: 47.5% in 2013
After a number of adds, I am now over my minimum $40,000 allocation after a bout of profit taking last year.
SPDR S&P Regional Banking ETF (KRE) Total Returns: 47.5% in 2013
One ETF will own several of the small cap regional banks and REITs that I own now or have owned in the past: PSCF | S&P SmallCap Financials Portfolio
In 2013, my dividend total from this basket totaled $1,932,93, up from $1,896.25 in 2012 and $1,660.57 in 2011. I will have to increase my current exposure in order to exceed the 2013 amount this year, given my light exposure for the first four months which was several thousand below the "minimum" level.
Regional bank stocks are basically churning in price this year as interest rates started to go back down. One of the regional bank ETFs, KRE, closed at $40.61 on 12/31/13 and at KRE: 38.93 +1.02 (+2.69%) today, but has closed as low as $36.84 this year (2/3/14). SPDR S&P Regional Banking ETF ETF Chart
I have nibbled at this ETF: Bought Taxable Accounts: 50 KRE at $39.55 (9/20/14 Post)
The abnormally low rates benefited banks some when deposit yields were repriced down, but even 5 year bank CDs taken out in 2008 at higher rates have now matured, and the positive impact of that repricing is no longer present to any meaningful degree.
Instead, the decline in rates for loans simply compresses net interest margin. When rates were rising last year, regional bank stocks were in an uptrend based on the common belief that higher intermediate and long rates would be a net positive for them, particularly when short terms were likely to remain near zero through mid-2015 and then rise slowly and modestly in 2016-2017. The rate spike starting last May impacted intermediate and long term rates. Short term rates remained anchored by ZIRP.
I have used the downdraft in prices this year to add positions to my basket after selling into last year's strength.
Since the last update, I have eliminated three positions: Sold 50 AMNB at $23.03; Sold: 100 HBAN at $9.53 (10/17/14 Post). The third is briefly mentioned below.
I added a 50 share lot of ONB, mentioned below.
The yields shown in the table below are calculated by Yahoo Finance based on today's closing prices rather than at my total cost per share.
Dividends Received 2010 through 2013=$6,623.72
Click to Enlarge:
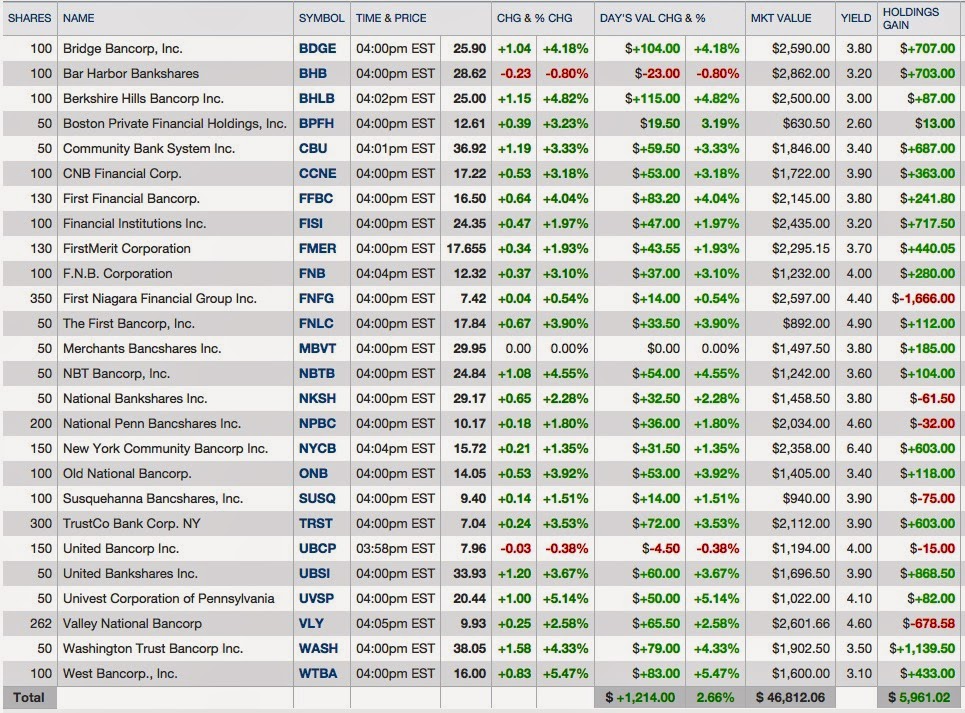 |
| Regional Bank Basket as of 10/28/14 |
Comparison Data From the St. Louis Fed:
Net Interest Margin for all U.S. Banks
Net Interest Margin for U.S. Banks with average assets under $1B
Net Interest Margin for U.S. Banks with average assets between $1B and $15B
Return on Average Equity for all U.S. Banks (abbreviated to "ROE")
Return on Average Assets for all U.S. Banks (abbreviated to "ROA")
Nonperforming Loans (past due 90+ days plus nonaccrual) to Total Loans for all U.S. Banks (abbreviated to "NPL ratio")
Charge-Off Rate On All Loans, All Commercial Banks
Assets at Banks whose ALLL exceeds their Nonperforming Loans (I prefer a coverage ratio of over 100% at the time of my initial purchase)(ALLL=Allowance for loan losses)
New Capital Rules From the FDIC to Implement Basel III Capital Rules:
Google deleted about 15 discussions of third quarter bank earnings reports when the entire update for the three baskets was deleted by it last Friday. I subsequently discussed in more depth than usual two of those earnings reports at SA and will not rewrite the others. Regional Bank Basket Strategy: West Bancorporation Earnings Report Today - South Gent | Seeking Alpha; Regional Bank Basket Strategy: Bridge Bancorp 3rd Quarter Earnings Release - South Gent | Seeking Alpha I may discuss one more report that has not yet been released at SA.
1. First Merit (FMER): FirstMerit reported third quarter net income of $63.9M or $.37 per share, which was in line with the consensus estimate.
 |
| Performance Ratios |
 |
| Asset Quality |
After selling my 100 highest cost shares, I currently own 141+ at an average cost per share of $14.52: Item # 2 Bought 30 FMER at $11.35 (August 2011); Item # 2 Added 50 FMER at $15.2 (September 2012); Item # 3 Added 50 FMER at $15.09 (February 13, 2013 Post) The foregoing purchases account for 130 of the 141+ shares with shares purchased with dividends accounting for the remainder.
I rate FMER as a hold. I am reinvesting the dividend at the moment.
FMER Interactive Chart

I have harvested one gain so far: Item # 1 Sold 50 BHLB at $28.74+ (7/13/13 Post)-Item # 2 Bought 50 BHLB AT $21.66 (3/12/12 Post)
The stock burst through its 50 and 200 day SMA lines to the upside today BHLB Interactive Chart
3. NBT Bancorp (NBTB): NBT Bancorp reported core net income of $19.8M or $.45 per share.
The consensus estimate was for $.44. NBTB Analyst Estimates


NBTB is currently trading above its 50 and 200 day SMA lines: NBTB Interactive Chart
4. First Niagara: My disaster in this basket is FNFG, a loser that keeps on giving. My original investment thesis was okay. My mistake was keeping the stock after I recognized that the $1B acquisition of HSBC branches was idiotic and boneheaded in the extreme. It might be a toss up on whether the Board's approval of that train wreck was stupider than my decision to keep the stock after calling it a stupid decision.
These posts were written in 2011: First Niagara: Just Another Incompetent Bank Board of Directors; First Niagara Dividend Slash I have been critical of FNFG's inept Board and management team for over three years but I held onto to the stock hoping that a larger bank would rescue this beached whale. The odd thing about First Niagara is that it weathered the Near Depression period just fine. The massive destruction of shareholder equity did not start until 2011.
The last report was just pathetic. The bank wrote down $800 million in its boneheaded acquisition resulting in a GAAP loss to shareholders of $1.9 per share. A $45M reserve was set aside for something oblique called a "process issue related to certain customer deposit accounts". Wow, that was the first time that I have seen that decree of ineptitude. First Niagara Reports Third Quarter 2014 Results
Management is also spending a great deal of money upgrading its computer systems and I wonder whether that process issue is related that "upgrade". I noted in an earlier post that the new CEO (the other one was sent out to pasture) had embarked on a spending spree to upgrade FNFG's systems that will retard earnings for several years and have uncertain benefits. That plan caused a slide in the price earlier this year, FNFG Interactive Chart. (price went from $10.48 on 1/22/14 to $8.22 on 2/3/14).
FNFG is easily the worst managed bank in my basket.
I have been hoping that another bank will end the misery of FNFG's shareholders by making a generous acquisition offer, sending the current management team and Board into an early and much deserved retirement where they can not inflict further harm on the innocent.
Perhaps, that "hope" is born from early onset dementia.
I am reinvesting the dividend which was cut in half a few years ago to help finance the indefensible acquisition of HSBC branches for $1B in cash which was called a "home run" by the now departed CEO who engineered it. Incompetence piled on top of incompetence.
I am an involuntary holder of FNFG stock. While the Board did declare a dividend for the current quarter, further dividends will have to be approved through 2017 by the regulator due to that massive write-off.
4. Sold 100 TRMK at $24.45-In a Satellite Taxable Account (see Disclaimer): Regional bank stocks were having a robust move today, so I decided shortly before the close to sell one position into the rally. This last transaction completes my 4th round-trip in TRMK shares. I simply elected to exit this obvious trading position rather than to take a chance on the earnings report which was scheduled to be released after the close.
Snapshot of Trade:

Snapshot of Profit (includes earlier 50+ share disposition):
I bought this lot a few weeks ago. Item # Bought 100 TRMK at $23.12 (8/9/14)
I held the shares long enough to receive one dividend:
Total Return=$142.1 or 6.13% annualized (holding period about 3 months)
Item # 1 Sold Taxable Accounts: 50+ TRMK at $24.63 (7/19/14 Post)-Item # 6 Bought: 50 TRMK at $22.73 (5/10/14 Post); Item # 3 Bought 50 TRMK at 19.57 August 2010-Item # 3 Sold 50 TRMK at 24.7 January 2012; Item # 1 Sold 50 Trustmark at $26.52 July 2013-Bought 50 TRMK at $21.54 November 2012 (snapshots in Gateway Post for Regional Bank Basket)
Total Realized Gains from 3 Fifty Share Lots: $555.03
Total Realized Gain 4 TRMK Trades in the Regional Bank Basket= $674.13
The consensus 3rd quarter E.P.S. was for $.44: TRMK Analyst Estimates The bank reported net income of $33.6M or $.50 per share. SEC Filed Press Release
5. Added 50 ONB Shares at $12.45 (see Disclaimer): I discussed this purchase in a SA Instablog: Regional Bank Basket Strategy: Added 50 ONB At $12.45 - South Gent | Seeking Alpha
Subsequent to that purchase, ONB reported better than expected earnings. Old National's 3rd Quarter Highlighted by 6.5% Annualized Organic Loan Growth (Excluding Covered Loans) and a Continued Strong Loan Pipeline
Closing Price 10/28/14: ONB: $14.05 +0.53 (+3.92%)
The stock burst through its 50 and 200 day SMA lines to the upside today BHLB Interactive Chart
3. NBT Bancorp (NBTB): NBT Bancorp reported core net income of $19.8M or $.45 per share.
The consensus estimate was for $.44. NBTB Analyst Estimates
NBTB is currently trading above its 50 and 200 day SMA lines: NBTB Interactive Chart
4. First Niagara: My disaster in this basket is FNFG, a loser that keeps on giving. My original investment thesis was okay. My mistake was keeping the stock after I recognized that the $1B acquisition of HSBC branches was idiotic and boneheaded in the extreme. It might be a toss up on whether the Board's approval of that train wreck was stupider than my decision to keep the stock after calling it a stupid decision.
These posts were written in 2011: First Niagara: Just Another Incompetent Bank Board of Directors; First Niagara Dividend Slash I have been critical of FNFG's inept Board and management team for over three years but I held onto to the stock hoping that a larger bank would rescue this beached whale. The odd thing about First Niagara is that it weathered the Near Depression period just fine. The massive destruction of shareholder equity did not start until 2011.
The last report was just pathetic. The bank wrote down $800 million in its boneheaded acquisition resulting in a GAAP loss to shareholders of $1.9 per share. A $45M reserve was set aside for something oblique called a "process issue related to certain customer deposit accounts". Wow, that was the first time that I have seen that decree of ineptitude. First Niagara Reports Third Quarter 2014 Results
Management is also spending a great deal of money upgrading its computer systems and I wonder whether that process issue is related that "upgrade". I noted in an earlier post that the new CEO (the other one was sent out to pasture) had embarked on a spending spree to upgrade FNFG's systems that will retard earnings for several years and have uncertain benefits. That plan caused a slide in the price earlier this year, FNFG Interactive Chart. (price went from $10.48 on 1/22/14 to $8.22 on 2/3/14).
FNFG is easily the worst managed bank in my basket.
I have been hoping that another bank will end the misery of FNFG's shareholders by making a generous acquisition offer, sending the current management team and Board into an early and much deserved retirement where they can not inflict further harm on the innocent.
Perhaps, that "hope" is born from early onset dementia.
I am reinvesting the dividend which was cut in half a few years ago to help finance the indefensible acquisition of HSBC branches for $1B in cash which was called a "home run" by the now departed CEO who engineered it. Incompetence piled on top of incompetence.
I am an involuntary holder of FNFG stock. While the Board did declare a dividend for the current quarter, further dividends will have to be approved through 2017 by the regulator due to that massive write-off.
4. Sold 100 TRMK at $24.45-In a Satellite Taxable Account (see Disclaimer): Regional bank stocks were having a robust move today, so I decided shortly before the close to sell one position into the rally. This last transaction completes my 4th round-trip in TRMK shares. I simply elected to exit this obvious trading position rather than to take a chance on the earnings report which was scheduled to be released after the close.
Snapshot of Trade:
Snapshot of Profit (includes earlier 50+ share disposition):
 |
| 2014 TRMK 100 Shares +$119.1 |
I held the shares long enough to receive one dividend:
| Quarterly Dividend=$23 on 100 Shares |
Item # 1 Sold Taxable Accounts: 50+ TRMK at $24.63 (7/19/14 Post)-Item # 6 Bought: 50 TRMK at $22.73 (5/10/14 Post); Item # 3 Bought 50 TRMK at 19.57 August 2010-Item # 3 Sold 50 TRMK at 24.7 January 2012; Item # 1 Sold 50 Trustmark at $26.52 July 2013-Bought 50 TRMK at $21.54 November 2012 (snapshots in Gateway Post for Regional Bank Basket)
Total Realized Gains from 3 Fifty Share Lots: $555.03
Total Realized Gain 4 TRMK Trades in the Regional Bank Basket= $674.13
The consensus 3rd quarter E.P.S. was for $.44: TRMK Analyst Estimates The bank reported net income of $33.6M or $.50 per share. SEC Filed Press Release
5. Added 50 ONB Shares at $12.45 (see Disclaimer): I discussed this purchase in a SA Instablog: Regional Bank Basket Strategy: Added 50 ONB At $12.45 - South Gent | Seeking Alpha
Subsequent to that purchase, ONB reported better than expected earnings. Old National's 3rd Quarter Highlighted by 6.5% Annualized Organic Loan Growth (Excluding Covered Loans) and a Continued Strong Loan Pipeline
Closing Price 10/28/14: ONB: $14.05 +0.53 (+3.92%)
