Economy:
Employment Situation Summary: The BLS reported that the economy added 559K jobs last month. The consensus according to FactSet was at 650K. The unemployment rate declined .3% to 5.8%. The average workweek was unchanged at 34.9 hours. Average hourly earnings increased by 14 cents to $30.33, or .5% month-over-month, following a 21 cent increase in April. The BLS noted that this surge in compensation suggests "that the rising demand for labor associated with the recovery from the pandemic may have put upward pressure on wages."
ISM's index for manufacturing rose to 61.2 last month, up from 60.7 in April. The new orders component increased to 67 from 64.3 in April. Manufacturing accounts for about 12% of the U.S. economy.
ADP private payrolls May 2021: +978K
Costco is seeing inflation abound, impacting a slew of consumer products
U.S. manufacturers blame Trump-era tariffs for inflation’s rise - MarketWatch
As of 12:35 E.D.T. today, the ten-year treasury yield has declined by 7 basis points to 1.55+%. U.S. 10 Year Treasury Note Overview | MarketWatch Regional bank stocks are treading down:
SPDR S&P Regional Banking ETF (KRE): $70.08 - $.76 or 1.08% as of $12.35 E.D.T.
+++
Markets and Market Commentary:
Shiller PE Ratio - 150 Year Chart | Longtermtrends
Market Cap to GDP-The Buffett Indicator-Updated Historical Chart | Longtermtrends
The Q Ratio and Market Valuation: May Update - dshort - Advisor Perspectives (6/3/21)(2.98 compared to a 2.15 high in 1999)
Our Ultimate Stock-Pickers' Top 10 High-Conviction Purchases | Morningstar
AbbVie's (ABBV) Skyrizi Succeeds in Crohn's Maintenance Study - June 3, 2021 - Zacks.com
Selected Earnings Reports Owned Stocks:
Aegon (AEG) reports first-quarter 2021 results (operating result increases 20% to €431M with the consensus estimate at €378M; free cash flow = €75M)
Brookfield Asset Management (BAM) reports $6.4 billion of Investment Gains in First (Net income attributable to common shareowners = $1.235B or $.77 per share with FFO per share at $1.8)
Power Corporation (PWCEF) Reports First Quarter 2021 Financial Results (Reported E.P.S. = C$.82; adjusted E.P.S. at C$1.16, up from C$.62 in the 2020 1st quarter; PWCEF is the symbol for the USD priced shares that trade on the pink sheet exchange)
Scientific Applications International (SAIC) Announces First Quarter of Fiscal Year 2022 Results (GAAP E.P.S. at $1.38; Adjusted E.P.S. = $1.94 with the consensus at $1.512 per Fidelity; revenues up 7% Y-O-Y to $1.878B; free cash flow up 4% to $164M; raises fiscal 2022 adjusted E.P.S. guidance to $6.15 to $6.4 from $6.00 to $6.25; the 2022 fiscal year ends 1/28/22)
Salesforce (CRM) Announces Strong First Quarter Fiscal 2022 Results (GAAP E.P.S. at $.50; non-GAAP E.P.S. = $1.21 with the consensus at $.885 per Fidelity; mark-to-market accounting of the company’s strategic investments benefited GAAP diluted earnings per share by $0.23 based on a U.S. tax rate of 25% and non-GAAP diluted earnings per share by $0.24 based on a non-GAAP tax rate of 21.5%; revenues at $5.96B, up 23%; "Cash generated from operations for the first quarter was $3.23 billion, an increase of 74% year-over-year. Total cash, cash equivalents and marketable securities ended the first quarter at $15.02 billion."; second-quarter fiscal year revenue guidance between $6.22B to $6.23B, up about 21% Y-O-Y)
Splunk Inc. (SPLK) Announces Fiscal First Quarter 2022 Financial Results (GAAP E.P.S. -$2.89; Non-GAAP at -$.91; cloud revenue up 73% to $194M; total revenues = $502M, up 16% Y-O-Y; Cloud "ARR" at $877M; Total ARR +$2.47B, up 38% Y-O-Y; "Total Annual Recurring Revenue (“Total ARR”) represents the annualized revenue run-rate of active cloud services, term license and maintenance contracts at the end of a reporting period. Cloud Annual Recurring Revenue (“Cloud ARR”) represents the annualized revenue run-rate of active cloud services contracts at the end of a reporting period. Each contract is annualized by dividing the contract value by the number of days in the contract term and then multiplying by 365.")
TransAlta Renewables (TRSWF) Reports First Quarter 2021 Results and Closes Acquisition of 303 MW Asset Portfolio including 274 MW of Wind Capacity from TransAlta ($ amounts in CADs; cash available for distribution "of $90 million or $0.34 per share in the first quarter, in line with the same period in 2020; dividends paid in the quarter = $.23, paid in monthly installments; renewal energy production 1,109 GWh)
+++
Interest Payments Received 6/1/21-Fidelity Taxable:
I am still receiving a decent amount of bond interest payments notwithstanding the now frequent issuer optional redemptions. Corporate bond interest payments will be down significantly this year compared to 2020.
Municipal Bond Interest Payments this account: $784.38


Corporate Bond Interest Payments this account-All 1 Bond Lots: $100.63
 |
| Entergy Subsidiaries: First Mortgage Bonds |


++
Schwab Reclaims Partial Roche Dividend Tax:
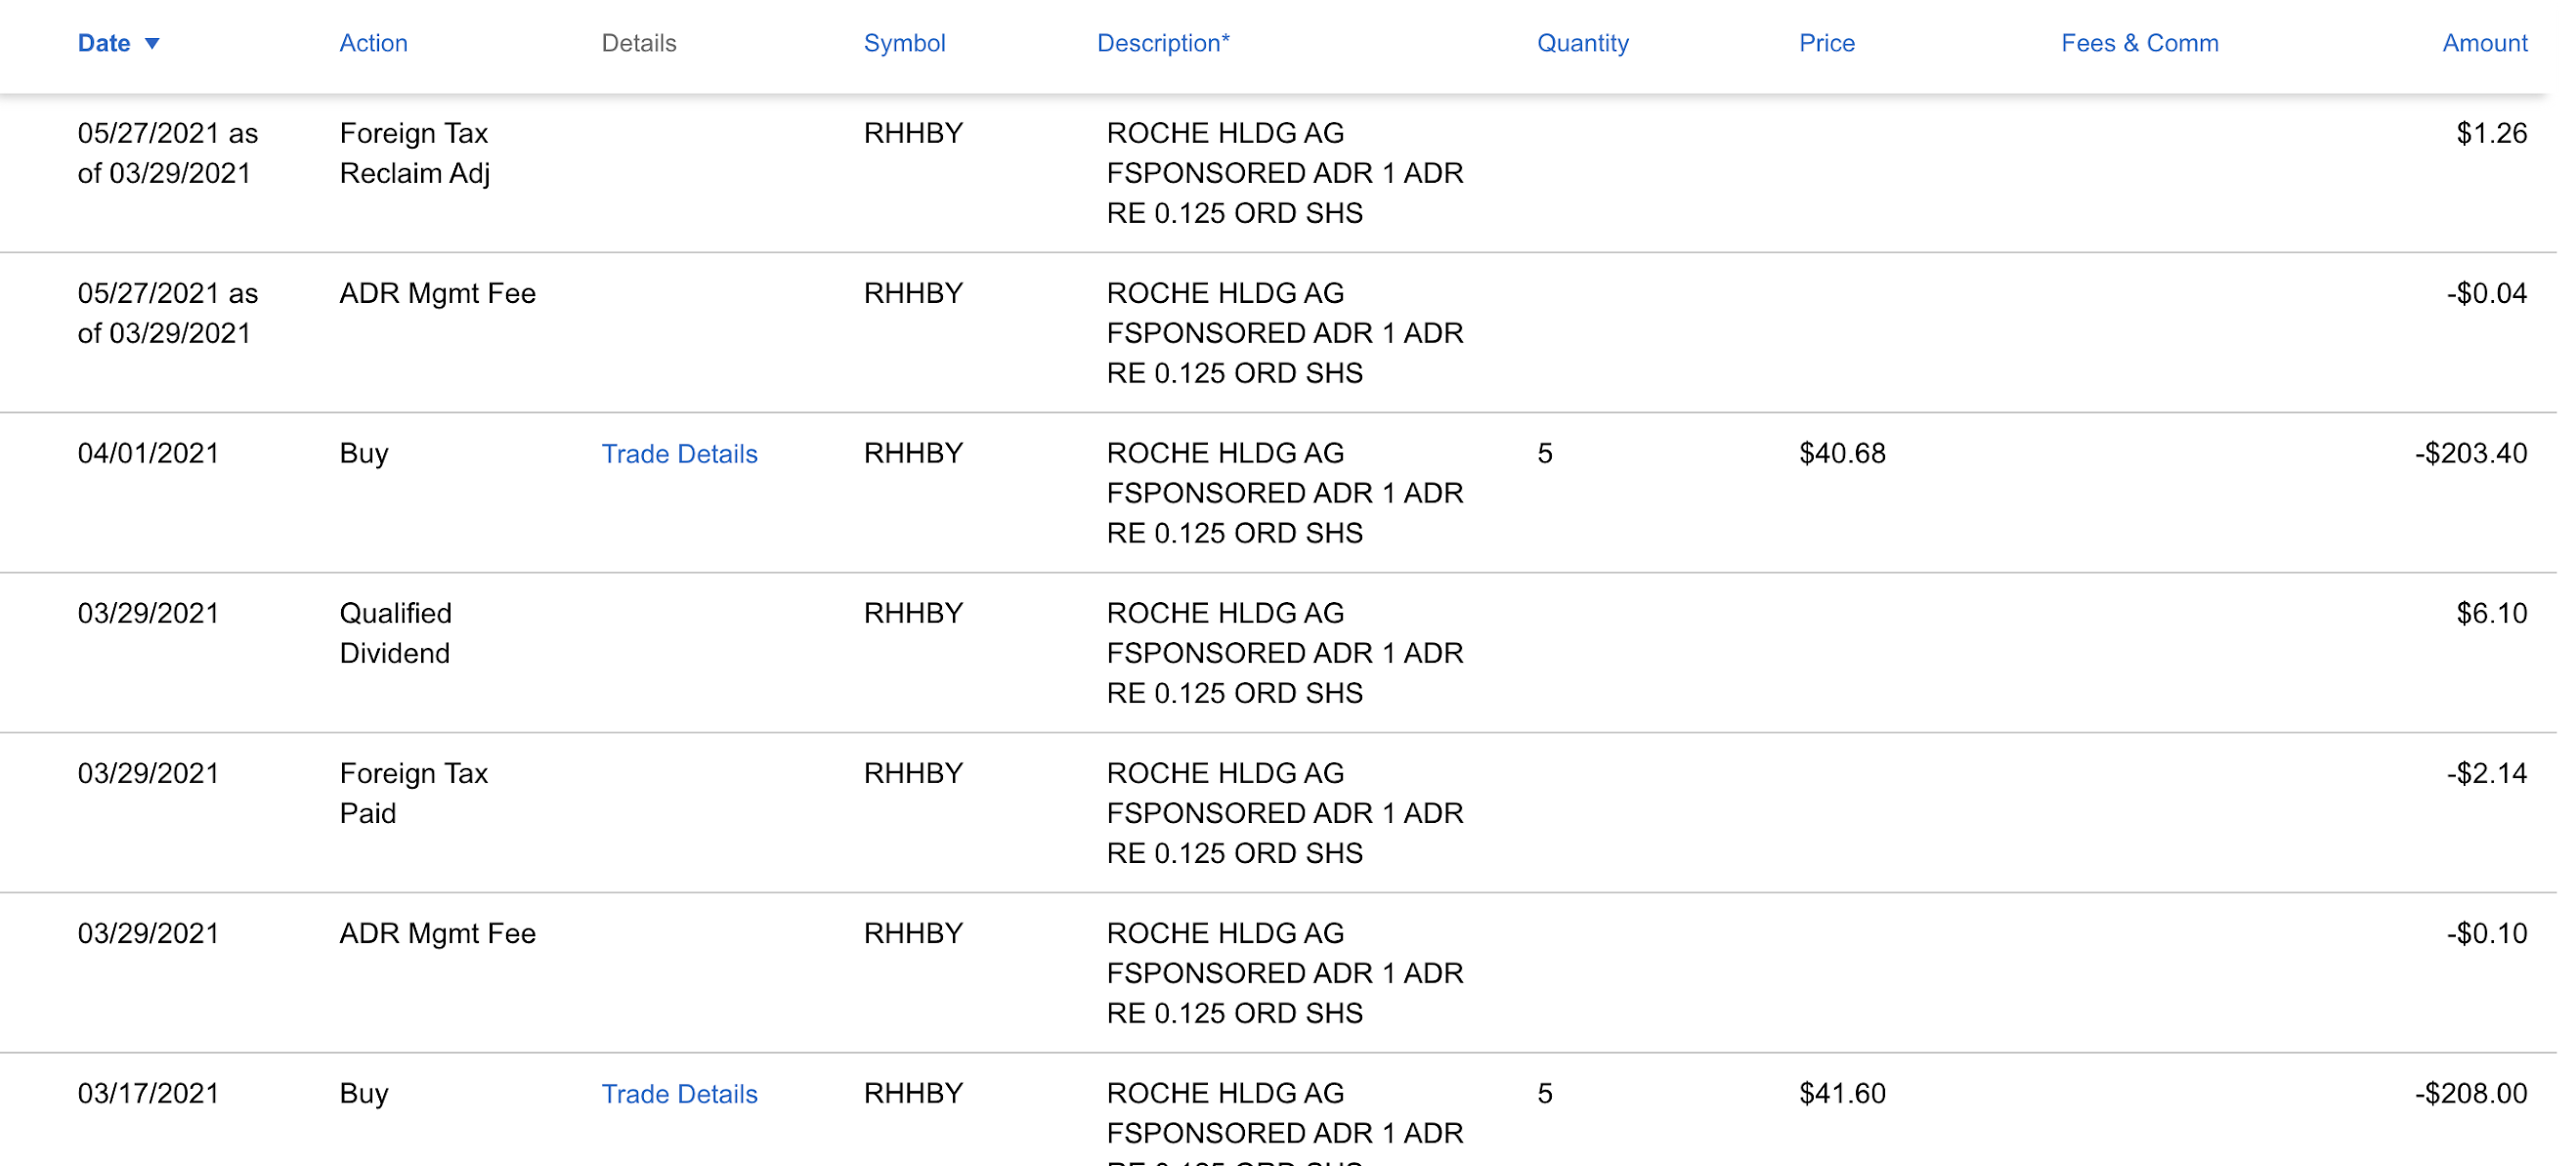
I do not recall Schwab reclaiming an overpayment of a foreign dividend tax.
When I initially received the Roche 2021 annual dividend, Switzerland withheld 35% as a dividend tax ($2.14 tax ÷ $6.1 dividend = 35% tax rate).
The Switzerland-U.S. tax treaty provides that no more than a 15% tax can be collected from a dividend paid to a U.S. citizen. However, to claim that treaty right initially, the broker must assert this treaty right "at the source". There is also a process to assert the treaty tax limit subsequent to the payment, which is what Schwab did here by reclaiming $1.26 of the $2.14 previously paid. The reclaimed $1.26 required a 4 cent upward adjustment in the ADR management fee, a recalculation that could have been avoided by asserting the treaty right at the source.
I own RHHBY in two taxable accounts (15 shares in my Fidelity account with a $40.86 AC per share; 10 shares in my Schwab account with a $41.14 AC per share).
Fidelity also did a reclamation:

++
Majorie Taylor Greene (R-GA): “You know, Nazis were the National Socialist Party. Just like the Democrats are now a national socialist party.” I am confident that Ms. Greene would be viewed as a qualified candidate to teach history in her congressional district.
Texas Republicans finalize a bill that would enact stiff new voting restrictions and make it easier to overturn election results - The Washington Post; Texas Republicans unveil sweeping voting restrictions bill - CBS News The Texas Republicans are starting to see their power fade some and are taking steps to preserve their power position through anti-democratic means.
The GOP Now Stands for Nothing Other Than Its Right to Rule- The Atlantic
Michael Flynn Says Coup Like in Myanmar 'Should Happen' in America The primary threat to America's democracy and freedoms comes from within. And, there is no question IMO that this threat is growing exponentially. 74.2+M Americans voted to give the most powerful enemy to America's democracy since the nation's founding another 4-year term as President.
Texas voting bill goes further than predecessors in limiting Black churches - The Washington Post The Texas republicans do not want blacks to meet for Sunday service and then proceed en masse to vote which is a historical way for blacks to organize and get out the vote.
Opinion | A frantic warning from 100 leading experts: Our democracy is in grave danger - The Washington Post, referencing this document: Statement of Concern
Paul Allard Hodgkins, 38, pleads guilty to a felony in capitol riot - The Washington Post He was photographed wearing Trump 2020 garb. In Trump's America, everyone who stormed the Capital wearing Trump emblazoned clothing, MAGA hats, and waving Trump flags were in fact Antifa members in disguise who created havoc inside the nation's capital in order to embarrass Don the Authoritarian. In TrumpWorld, the Antifa members even went so far as to have pro-Trump media posts spanning years and prior attendances at Trump rallies dressed in Trump MAGA hats and garb to further their deception.
66 percent of GOP want Trump to run for reelection: poll | TheHill
+++
1. Canadian ETFs:
The SEC has banned new purchases of Canadian ETFs that do not file prospectuses with that agency. The prospectuses, which almost no one reads, are available for anyone interested in reviewing them at the sponsors' websites. Since I was no longer allowed to buy shares, I decided to sell all of my positions but was not allowed to do so online by IB for about 5 months.
A. Eliminated FIE:CA-Sold 600 at C$7.81:

Quote: iShares Canadian Financial Monthly Income ETF
Profit Snapshot: +C$883.5

Recent Buy Discussions: Item # 3 Added 100 FIE:CA at C$5.05 and 100 at C$5.47 (5/9/20 Post); Item # 1 Bought 100 FIE:CA at C$6.74 (9/21/19 Post); Item # 1 Added 100 FIE:CA at C$6.84 .(7/13/19 Post): Item # 2. Bought 100 FIE:CA at C$6.92 (4/7/19 Post)
Dividend: Monthly at C$.04 per share
Previous Round-Trips: Item # 5. Sold 300 FIE:CA at C$7.64 (11/26/17 Post)(profit snapshot = C$160); Item # 5. Sold 300 FIE:CA at C$7.64 (11/26/17 Post) (profit snapshot=C$35)(contains snapshots of prior round-trip trades= USD$391.32 for 1500 shares and US$58.07 for 300 shares; C$166 for 200 shares); Item # 2.C. Sold 100 FIE:CA at C$7.33 (12/11/19 Post)(profit snapshot = C$3) Some of the profit snapshots are in USDs since the broker converted the CAD profit into USDs.
FIE:CA Profits Realized to Date:US$449.39 (converted from CADs by Fidelity)
C$1,087.5 (IB trades)
B. Eliminated XRE:CA-Sold 100 at C$18.45:

Quote: XRE | iShares S&P/TSX Capped REIT Index ETF Overview
Sponsor's Website: iShares S&P/TSX Capped REIT Index ETF | XRE
Number of Holdings: 20
Top 10 Holdings as of 5/27/21:

Of those holdings, I currently own Riocan and Dream Industrial. My largest position is 1,000 Northwest Healthcare units (600 priced in CADs and 400 priced in USDs) which had a 3.42% weighting in this ETF as of 5/27.
Expense Ratio: .61%
Last Discussed: Item # 3. Bought 100 XRE:CA at C$15.12(8/8/20 Post)
Profit Snapshot: +C$331

Dividends: Monthly at a variable rate. All dividends were paid in CADs.
2. Canadian Reset Equity Preferred Stocks:
A. Eliminated FFHPRI-Sold 200 at C$18.71:

Quote: FFH-PI.TO
Security: Reset Equity Preferred Stock
Par Value: C$25
Coupon: 2.85% spread to the 5 year Canadian Bond, resets every five years
Last Reset: December 2020
Issuer: Fairfax Financial Holdings Ltd. (Canada: Toronto)
Profit Snapshot: +C$433.5

Last Discussed: Item # 1. Added 50 FFHPRI:CA at C$16.55 (1/2/20 Post)
I discussed the reason for this elimination in a 5/23/21 comment.
Reset December 2020 at a 3.327% coupon:

Next Reset: December 2025
Dividends: Paid quarterly and cumulative
3. Small Ball:
Baseball analogy-Small ball (baseball)-Wikipedia
The underlying rationale for the small ball trading strategy is risk mitigation in what I view as a dicey stock market whose parabolic rise has been fueled by (1) unprecedented money creation; (2) central bank suppression of interest rates far below the inflation rate through extraordinarily abnormal monetary policies continued now for over a decade; (3) extreme levels of U.S. government deficit spending, and (4) spending rapidly increasing amounts of borrowed money by U.S. households and corporations.
It is only a question of time until those stimulus measures will no longer be available or will have to be reduced to a level that will not be sufficient to move the needle. Until that becomes apparent, I will continue to maintain a relatively low stock allocation, focused primarily on income generation and some harvested capital gains.
(1) Each purchase has to be at the lowest price in the chain; or has to lower my average cost per share;
(2) Purchases are made in small lots, using commission-free trades;
(3) On price pops, I will consider selling my highest cost shares at a profit, no matter how small;
(4) Some positions will be eliminated altogether on price pops when the goal is achieved;
The corollary is to buy the dips, particularly during extreme volatility events that would be associated with major declines in stocks.
Another aspect is selling fractional shares bought with dividends in order to harvest the original dividend amount plus a small profit on the shares. I am doing that regularly now, having turned off the dividend reinvestment option in virtually all stocks that I own.
The primary known threats to the stock market are inflation and valuations. The primary assumption is that the extraordinary stimulus measures outlined above can continue indefinitely or that the economy will experience robust growth when they have to be withdrawn.
A. Bought 1 ETSY at $159.7:

Quote: ETSY
Etsy - Shop for handmade, vintage, custom, and unique gifts for everyone
ETSY Analyst Estimates | MarketWatch
I view ETSY as overvalued using traditional valuation measures. The consensus non-GAAP E.P.S. estimate for 2021 is currently at $3.01 and at $5.24 in 2023. Using the $3.01 non-GAAP estimate for 2021, the current P/E is 53.06 at $159.7, which is too high IMO, but falls to 30.48 by 2023 using the $5.24 consensus estimate.
If the company can continue that projected growth rate for several years, it will then justify its current P/E multiple based on a $159.7 stock price IMO, but that growth will not be fueled by mask sales which drove the stellar 2020 growth rate unless the pandemic roars back.
And investors have shown a willingness in recent years to assign higher multiples for growth stocks than in the past, justified in large part by low inflation and interest rates and by overall sluggish earnings and revenue growth in many industries.
Recent News: Etsy is buying fashion resale app Depop for $1.62 billion (6/2/21); SEC Filed Press Release
Key Operating Metrics 2018-2020 (page 75 Annual Report):

I mentioned this purchase in a 5/12/21 comment.
Last Earnings Report (Q/E 3/31/21): SEC Filed Press Release
GMS = Gross Merchandise Sales

Revenues: $550.6M vs. consensus at $530.4M
GMS up 132% to $3.1B.
Ended the quarter with 90.6M active buyers, up 90%.
The Stock Jocks responded negatively to this report due to ETSY's forward guidance.
For the current quarter, ETSY forecasted revenue growth of 15% to 25% ($493M to $536M) compared to triple-digit growth rates in the prior 4 quarters.
The company experienced a significant bump in revenues and profits related to mask sales. The question is whether ETSY can convert the mask buyers into regular buyers of other products.
The stock price peaked at $251.86 (3/2/21). The stock had started to drift down before the earnings report due to concerns about future growth prospects. The stock closed at $184.57 on 5/5 prior to the earnings announcement and at $157.68 the next day. ETSY Historical
Broker Report (available to Schwab customers):
S & P (5/30/21): 3 stars with a 12 month PT of $180, cut $55 from the prior estimate.
Other Brokers Reports (unavailable to me):
Citigroup (5/10/21): Reduces PT to $245 from $260, maintains buy rating.
Stifel (5/7/21): Raises to buy with a $205 PT.
Oppenheimer (5/5/21): Maintains buy with a $200 PT reduced from $240.
Keybanc: Reaffirmed neutral rating, previously downgraded from outperform. Etsy Falls as Long-Time KeyBanc Bull Turns Neutral - TheStreet (4/26/21)
Morgan Stanley: Maintained underweight.
Etsy Slides as Analysts Weigh Earnings Beat, Soft Guidance - TheStreet
Purchase Restriction: 1 share lots with each subsequent purchase at the lowest price in the chain.
Maximum Position: 10 shares
B. Pared GIS in Fidelity Taxable account-Sold 1.592 at $64.42:

Quote: General Mills Inc
General Mills: Brands overview
General Mills Inc. Interactive Charts
Profit Snapshot: +$8.09 (5/13 sale only)

New Average cost per share this account: $56.13 (60 shares)
 |
| Snapshot Intraday on 5/13/21 after pare |
Dividend: Quarterly at $.51 per share
General Mills, Inc. - Stock Information
I am continuing to reinvest the dividend but will sell the shares purchased with dividends at a profit when and if I can do so. In this pare, the .592 fractional share was purchased with 2 dividend payments including the one paid on 4/29/21. I currently have no fractional shares purchased with dividends.
Yield at $56.13: 3.63%
Last Ex-Dividend Date: 4/8/21
I discussed the last earnings report in this post: Item # 1.A. Pared GIS in Fidelity Taxable-Sold 4 at $61.37 (4/17/21 Post); General Mills Reports Fiscal 2021 Third-Quarter Results
Last Buy Discussions: Item # 1.G. Added to GIS in Fidelity Taxable Account-Bought 5 at $55.9; 5 GIS at $55.5; 5 at $55.2; 5 at $54.9; 5 at $54.5; 5 at $54 (2/6/21 Post); Item # 1.A. and 1.B. Started GIS in Schwab Taxable account and Added to GIS in Fidelity Taxable Account (1/9/21 Post); Item # 1.F. Bought 2 GIS at $47.88 (3/28/20 Post); Item # 5 A. Bought 2 GIS at $40.25, 2 at $39.45, 10 at $38.3 and 5 at $36.75-Used Commission Free Trades (12/29/18 Post)
Other Sell Discussions: Item # 1.A. Eliminated GIS-Sold 27+ at $54.86 (3/21/20 Post)(profit snapshot = ($426.37); Item # 1.A. Sold 13 GIS at $55.02-Used Commission Free Trade (8/17/19 Post)(profit = $134.13); Item 1.B. Sold Highest Cost GIS lots at $51.69 (4/7/2019 Post); Item #2.A. Sold 10 GIS at $56.18-Used Commission Free Trade (12/21/17 Post) Snapshots of 2007 through 2017 round-trip trades can be found in Item 1.B. The largest single gain was $1,285.51 realized on a 52 share lot in 2016. There have not yet been any realized losses.
C. Pared K in Fidelity Taxable Account-Sold 1 at $67.93:

Quote: Kellogg Co. (K)
Kellogg Co. Analyst Estimates | MarketWatch
Kellogg Company | Our Brand Portfolio
Annual Report for the F/Y Ending 1/2/21
Investment Categories: Bond Substitute/Dividend Growth (recently sluggish)
I am selling my highest cost lots.
Last Buy Discussions: Item # 1.L. Added to Kellogg (K)-Bought 2 at $61; 1 at $60.5; 1 at $59.9; 1 at $59.4; 1 at $58.8; 1 at $58; 1 at $57.6 (1/30/21 Post); Item # 3.D. Added to Kellogg-Bought 4 at $62.7; 2 at $62.44; 2 at $61.3 (12/19/20 Post)(last substantive buy discussion); Item # 1 Bought 50 Kellogg at $55.44 and 10 at $54.68-Used Commission Free Trades (7/20/19 Post)
Profit Snapshot: $5.02 (5/13/21 sale only)

Average cost per share this account = $60.66 (23+ shares)
 |
| Snapshot Intraday 5/13 after pare |
Dividend: Quarterly at $.58 per share ($2.32 annually); last raised from $.57 effective for the 2021 second quarter payment.
Yield at New AC = 3.82%
Last Ex-Dividend: 5/28/21
Dividend reinvestment has been turned off.
Last Earnings Report (Fiscal Q/E 4/3/21): SEC Filed Press Release


SU Debt Ratings: BBB/Baa2-Fixed Income - Kellogg Company
Last Sell Discussions: Item # 1.L. Pared K-Sold 2 at $65 (4/17/21 Post)(profit snapshot = $1.57); Item # 1.B. Sold 30 K at $66.3 (3/21/20 Post)(profit snapshot = $332.32); Item # 2. Pared Kellogg- Sold 10 at $69.3 (1/8/2020 Post)(profit snapshot = $138.58); Item # 2.C. Sold 10 K at $66.3 (12/28/19 Post)(profit snapshot = $108.58); Item # 3.B. Sold 10 K at $63.95 (8/10/2019 Post)(profit snapshot = $85.08)
The K stock purchases in 2019 were probably my first. I have owned its senior unsecured bonds.
Kellogg (K) Realized Gains to Date: $671.15
D. Pared REYN in Schwab Taxable-Sold 5 at $31.5:

Quote: Reynolds Consumer Products Inc. (REYN)
REYN Analyst Estimates | MarketWatch
Website: Reynolds Consumer Products
Investment Categories: Bond Substitute/Contrarian Value
Last Buy Discussions: Item # 2.O. Adeed to REYN in Schwab Taxable-Bought 4 at $27.5; 5 at $27.3 (3/6/21 Post); Item # 1.Q. Added to REYN-Bought 2 at $27.9; 2 at $27.67 (2/27/21 Post); Item # 1.J. Started REYN in Schwab Taxable Account-Bought 5 at $29.95; 5 at $28.95; 2 at $28.58 (2/20/21 Post)
Profit Snapshot: +$7.75

New Average Cost per share this account = $27.78 (20+ shares)
 |
| Snapshot Intraday 5/14/21 after pare |
By selling the highest-cost lot, I reduced the AC from $28.37 to $27.78 and increased the dividend yield to 3.31% from 3.24%.
Dividend: Quarterly at $.23 per share ($.92 annually)
Last Ex-Dividend: 5/12/21 (Sold after ex-dividend date)
Last Earnings Report (Q/E 3/31/21): Reynolds Consumer Products (REYN) Reports First Quarter 2021 Financial Results
GAAP E.P.S. at $.35, non-GAAP at $.36 with the consensus at $.364 per Fidelity;
revenues up 4% to $757M;
2021 guidance now at non-GAAP E.P.S. between $1.83 to $1.94 with revenue growth in the high single digits compared to $3.263B in 2020;
"the Company expects short-term earnings pressure in the second quarter, reflecting increases in commodity and logistics costs that precede price increases as well as continuing impacts from February’s storms."
E. Eliminated OGE-Sold 15 at $34.62:

Quote: OGE Energy Corp
OGE Energy Corp. Profile | Reuters
Corporate Profile | OGE Energy Corp.
OGE Analyst Estimates | MarketWatch
Buy Discussion: Item # 1.I. Started OGE-Bought 5 at $32.15; 1 at $31.63; 4 at $31.31; 5 at $30.7; 5 at $30.31 (1/30/21 Post)
Last Sell Discussion: Item # 1.J. (4/1/21 Post)
Profit Snapshot: $57.36 (5/14/21 sale only)

Last Earnings Report (Q/E 3/31/21): OGE Energy Corp. (OGE) reports first-quarter results
E.P.S. at $.26 with consensus at $.217 per Fidelity;
2021 guidance: "OG&E's earnings guidance remains unchanged and is between $352 million to $373 million, or $1.76 to $1.86 per average diluted share. Based on first-quarter 2021 results, including the impacts of the 2021 February extreme cold weather event and strong mitigation efforts, OG&E currently projects full year results in the lower half of the range"
F. Pared GOOD-Sold 2.197 shares at $20.8 and 2.352 at $20.84:


Quote: Gladstone Commercial Corp. (GOOD)
"Gladstone Commercial Corporation is a REIT that invests in single tenant and anchored multi-tenant net leased industrial and office properties nationwide." About Gladstone Commercial Corporation
As of 5/10/21, GOOD owned 120 properties totaling 15.5 million square feet of rentable space, located in 27 states. The occupancy rate was at 95.5%.
Investment Category: Equity REIT Common and Preferred Stock Basket Strategy
Last Buy Discussions: Item # 2.J. Added 2 GOOD at $13.35 (5/30/20 Post)
I eliminated all shares purchased with monthly dividend payments.
Profit Snapshot: +$20.77

New Average Cost per share = $13.19 (58 shares)
 |
| Snapshot Intraday on 5/26/21 after second pare |
These pares reduced the AC per share from $13.5.
Dividend: Monthly at $.1215 ($1.46 rounded annually)
Yield at New AC per share = 11.05%
Next Ex-Dividend: 6/17
Last Ex-Dividend: 5/18
Last Earnings Report (Q/E 3/31/21):
Gladstone Commercial Corporation (GOOD) Reports Results for the First Quarter Ended March 31, 2021
FFO per share = $.40; core FFO per share at $.42;
quarterly dividend per share = $.37545 paid in monthly installments;
properties = 120;
leased = 95.5%;
collected 98% of rents in the first quarter; sold 610,383 shares of common stock for $11.3M under ATM program
Last Sell Discussions: Item 1.M. Pared GOOD-Sold 12 at $18.72 and 10 at $19.76 (6/20/20 Post); Item # 1.C. Eliminated GOOD in Schwab Account-Sold 50+ at $20.88 and Item # 1.D. Sold Highest Cost GOOD Share in Fidelity Account at $21.36 (3/3/19 Post)
G. Bought 1 BOX at $23.38; 2 at $22.9:


Quote: Box Inc. Cl A
BOX is a new name for me.
BOX Annual Report for the F/Y Ending 1/31/21 "Box is the Content Cloud: one secure, cloud-native platform for managing the entire content journey. Content – from blueprints to wireframes, videos to documents, proprietary formats to PDFs – is the source of an organization’s unique value. Our cloud content management platform enables our customers, including 67% of the Fortune 500, to securely manage the entire content lifecycle, from the moment a file is created or ingested to when it’s shared, edited, published, approved, signed, classified, and retained. Box keeps content secure and compliant, while also allowing easy access and sharing of this content from anywhere, on any device."
BOX Analyst Estimates | MarketWatch
Box quarterly revenue tops $200 million for the first time - MarketWatch (5/28/21)
Last Earnings Report (Q/E 3/31/21): Box Reports Strong Fiscal First Quarter 2022 Financial Results
Non-GAAP E.P.S. at $.171
Consensus at $.18 per Fidelity
H. Eliminated CSWC-Sold 20 at $24.1:

 |
| Page 51 |
Profit Snapshot: +$220

Last Buy Discussions: Item # 1.B. Added 10 CSWC at $12.9(8/8/20 Post); Item # 4.F. Started CSWC-Bought 10 at $13.3 (6/27/20 Post)
Last Sell Discussion: Item # 1.L. Eliminated CSWC in Schwab Taxable Account-Sold 10 at $18.18 (2/27/21 Post)(profit snapshot = $59.5) I discussed the 2020 4th quarter report in that post.
Dividend: Last Quarterly at $.53 per share includes a $.10 per share special dividend.
CSWC Dividend History | Nasdaq
During the F/Y ending 3/31/21, CSWC paid out $1.65 per share in regular dividends and $.40 per share in special dividends. The special dividend payments are being sourced from prior undistributed NII. As of 3/31/21, the undistributed amount amounted to $.91 per share.
Next Ex-Dividend: 6/14/21
Last Earnings Report (4th Fiscal Quarter ending 3/31/21): SEC Filed Press Release

I. Pared SWZ-Sold 8.342 at $9.36:

Quote: Swiss Helvetia Fund Inc. Overview- A CEF
Last Buy Discussions: Item # 1.O. Averaged Up-Bought 3 SWZ at $8.83 (3/13/21 Post); Item # 2 Bought 100 SWZ at $7.92.(7/18/20 Post)
Sponsor's Website: SWZ Fund - Schroders
SEC Filing Holdings as of 3/31/21
Profit Snapshot: +$5.48

I sold all shares purchased with dividends or otherwise that had a cost basis of $8 or higher. I turned off dividend reinvestment.
Average cost per share this account after pare = $7.57
 |
| Snapshot Intraday 5/18/21 after pare |
Data Date of 5/18/21 Trade:
Closing Net Asset Value Per Share: $10.84
Closing Market Price: $9.37
Discount: -13.56
Sourced: SWZ CEF Connect
Discount at $7.57 AC to $10.84 NAV per share = -30.17%
As of 4/30/21, the 3 largest positions were Nestle, Roche, and Novartis, accounting for 40.44% of total assets.
J. Pared ERC-Sold 3.195 at $12.7:

Quote: Wells Fargo Multi-Sector Income Fund Overview- A CEF
SEC Filing: Holdings as of 1/31/21
SEC Filed Annual Report for the F/Y ending 10/31/20
Wells Fargo Multi-Sec Income (ERC) Quote | Morningstar (rated 3 stars)(shows ROC support for dividend payments)
I eliminated all shares that had a cost basis over $10 including all remaining shares bought with dividends.
Dividend reinvestment has been turned off.
Profit Snapshot: $7.08 (5/18/21 sale only)

Remaining Shares this account after pare = 40
 |
| Snapshot Intraday 5/18/21 after pare |
AC per share after pare = $8.82 (40 shares)
 |
| Snapshot Intraday 5/18/21 after pare |
Dividend: Monthly at a variable rate. Over the past 12 months, the dividend has fluctuated from a low of $.913 per to a high at $.0955. The dividend is supported by ROC.
Yield at new AC = 12.52% (assumes an average penny rate of $.092 over a 1 year period; actual results will vary)
Data as of 5/18/21 Trade:
Closing Net Asset Value Per Share: $12.88
Closing Market Price: $12.72
Discount: -1.28%
Average 5 Year Discount = -7.74%
Compared to this CEF's history, the -1.28% discount is abnormally low. Generally, I would eliminate a leveraged bond CEF when the discount is this low but decided to keep a few ERC shares for the dividend income.
Leveraged: Yes at close to 28% as of 5/28/21
Junk Bond Weightings as of 3/31/21: I am uncomfortable with these weightings.
BB: 28.4%
B: 25.22%
K. Pared CVA-Sold 13.204 at $15.07:

Quote: Covanta Holding Corp. (CVA)
CVA sells the energy generated by using garbage as a fuel and will receive a tip fee for taking the garbage. A tip fee is a charge based on the quantity of garbage received at CVA's waste-to-energy facilities.
CVA SEC Filings; 2020 Annual Report (see page 5 for a general summary of businesses)
Home | Covanta Environmental Solutions
Total Ash Processing - Covanta
The general idea will be to gradually pare the position by selling shares that were bought at over $10 per share. I will not be selling fractional shares that have a cost basis of less than $10. Dividend reinvestment however has been turned off.
Profit Snapshot: $4.05

Average Cost per share after pare: $13.9 (119 Shares)
 |
| Snapshot Intraday on 5/18/21 after pare |
Dividend: Quarterly at $.08 per share, cut from $.25 effective for the 2020 second quarter payment. This slash was largely related to the negative impacts of the pandemic. Covanta Investors-Dividends
While the cut was understandable under the circumstances, the slash took away a major reason for owning the stock.
Another negative is the company is over-leveraged IMO.
CVA's senior unsecured debt is currently rated at B1/B, which is another explanation for the dividend slash. CVA 6% SU Maturing on 1/1/2027-FINRA Page Arguably, the prudent course would be to eliminate the dividend and to use the extra cash to pay down debt.
Yield at New AC: 2.3%
Next Ex-Dividend: 6/23/21
Most Recent Bond Offering: Prospectus for $400M in SU Bonds maturing in 2030 (proceeds to be used to pay off 5.875% SU note maturing in 2024)
Last Earnings Report (Q/E 3/31/21): SEC Filed Press Release

2021 Guidance:

Last Sell Discussion: Item # 1.A. Eliminated CVA in Schwab Taxable Account-Sold 70 at $12.76 and Item # 1.B. Eliminated CVA in Vanguard Taxable -Sold 44+ at $13.19 (12/19/20 Post)(profit snapshots = $67.02 and $109.65)
CVA Realized Gains to Date: $180.72, an unsuccessful investment that required averaging down to escape with a profit.
L. Eliminated BZH-Sold 5 at $23.05:

Quote: Beazer Homes USA Inc. (BZH)- Homebuilder
BZH Analyst Estimates | MarketWatch
5 Year Financials: Earnings are highly erratic, moving on an annual basis from net income to net loss and back again to net income.

Annual Report for the Fiscal Year Ending 8/30/20 at page 25
Investment Category: Lottery Ticket Basket
Profit Snapshot: +$50.49

Item # 1.B. Bought 5 BZH at $12.95 (11/11/20 Post)
The only prior trade was a 10 share lot realizing a $77.59 profit.
The optimal time to own was when homebuilders experienced a long period of consecutive annual earnings. BZH produced a 626.14% return between 6/1/2000 to 1/9/2007. DRIP Returns Calculator | Dividend Channel The total return starting on 1/10/2007 through 5/21/2021 was -89.2% (starting price of $223.75 adjusted for reverse stock splits).
Last Earnings Report (Fiscal Second Q/E 3/31/21): SEC Filed Press Release
Diluted E.P.S. = $.81, up from $.35 year-ago quarter

M. Pared KEY-Sold Fractional Shares purchased with dividends at $22.96:

Profit Snapshot = +$3.64 (.403 share)

Average cost per share after pare: $12.18 (15 shares)
 |
| Snapshot Intraday 5/20/21 after pare |
AC was reduced from $12.23
Dividend: Quarterly at $.185 per share ($.74 annually), last raised from $.17 effective for the 2019 third-quarter payment.
As with most regional banks, the dividend was not raised in 2020 due to the credit issues and uncertainties created by the pandemic.
Yield at New AC per share = 6.08%
Last Ex-Dividend: 5/28/21
KeyCorp Declares Quarterly Cash Dividend On Common Shares And Preferred Stocks
I have turned off dividend reinvestment.
Last Earnings Report (Q/E 3/31/21): KeyCorp Reports Record First Quarter 2021 Net Income Of $591 Million, Or $.61 Per Diluted Common Share
NIM: 2.61%, down from 3.01% in the 2020 first quarter.
Cash Efficiency Ratio: 60.3%
ROA: 1.44%
ROE: 14.98%
ROTE: 18.25%
NPL Ratio: .72%
Charge Off Ratio: .46%
Coverage Ratio: 222%
Tangible Equity to Tangible Assets: 7.5%
Total Capital Ratio: 13.4%
Credit Loss Provision: Net benefit of $93M
Loan to Deposit: 73.1%
Last Elimination: Item # 1 Sold 140 KEY at $11.8 (7/27/2013 Post)(profit snapshot = $429.32)
KEY Realized Gains to Date: $738.95
N. Pared HOPE-Sold 17.644 at $15.59:

Quote: Hope Bancorp Inc.
"Hope Bancorp, Inc. is the holding company of Bank of Hope, the first and only super regional Korean-American bank in the United States with $17.2 billion in total assets as of March 31, 2021. Headquartered in Los Angeles and serving a multi-ethnic population of customers across the nation, Bank of Hope operates 53 full-service branches in California, Washington, Texas, Illinois, New York, New Jersey, Virginia and Alabama. The Bank also operates SBA loan production offices in Seattle, Denver, Dallas, Atlanta, Portland, Oregon, New York City, Northern California and Houston; commercial loan production offices in Northern California and Seattle; residential mortgage loan production offices in Southern California; and a representative office in Seoul, Korea."
HOPE Analyst Estimates | MarketWatch
I have been selling my highest cost lots.
Investment Category: Regional Bank Basket Strategy
Profit Snapshot: $34.63 (5/21 sale only)

New AC per share this account: $10.4 (34+ shares):
 |
| Snapshot Intraday on 5/21/21 after pare |
Dividend: Quarterly at $.14 per share ($.56 annually), last raised from $.13 effective for the 2018 second quarter payment.
Yield at New AC = 5.38%
Last Earnings Report (Q/E 3/31/21): SEC Filed Press Release

Last Sell Discussion: Item # 1.H. Pared HOPE in Fidelity Taxable-Sold 22 at $15.52 and 14 at $15.96 (4/1/21 Post)
O. Eliminated AVK-Sold 10 at $19.52:

Profit Snapshot: $64.34 (5/28/21 sale only)

Data Date of 5/28/21 Trade:
Closing Net Asset Valuer per share: $20.27
Closing Market Price per share: $19.49
Discount: -3.85%
Average 5 Year Discount: -10.98%
Sourced: AVK-CEF Connect
I discussed this leveraged CEF in my last post and have nothing further to add. Item # 2.O.(5/28/21 Post)
P. Added 5 TAK at $17.12; 5 at $16.73:


I discussed this company in my 5/23/21 post and have nothing substantively to add here. Item # 2.H. Bought 10 TAK at $17.22 (5/23/21 Post)
I will continue to average down in small lots until I hit 100 shares.
Current Position: 20 shares
Average Cost per share: $17.07
The dividend has been at 180 ¥ per share annually or 90¥ per ADR share. Share Data | Takeda
That would translate to about US$.82 per share at today's current exchange rate.
A semi-annual payment was made in March according to Morningstar. Takeda Pharmaceutical Co Ltd (4502) Dividends - XTKS | Morningstar
Q. Received Proceeds from GATX for early call of Baby Bond GMTA-Schwab Taxable:

Payment of Accrued Interest: $7.03

Investment Category: Exchange Traded Baby Bonds, a subcategory of Exchange Traded Bonds
Profit Snapshot: +$166.77

Discussed at Item # 4.A. Restarted GMTA-Bought 10 $18.21; 10 at $15.21 (4/18/20 Post)
As with other exchange-traded baby bonds, there was no make-whole provision in the prospectus that would have prevented an early call due to the penalty associated with it.
A make-whole payment is generally the sum total of all interest payments until the original maturity, which was 5/30/2066 for GMTA, and the principal amount discounted to present value using the yield of comparable U.S. treasury maturity (or a slow discount rate which juices the premium payment)
Call protection was for 5 years after issuance.
R. Finished Paring TPVG in Fidelity Account-Sold last fractional share:

Quote: TriplePoint Venture Growth BDC
Profit (.461 share) = $2.01 (6/1/21 sale only)

New AC per share this account = $6.22 (39 shares)
 |
| Snapshot Intraday 6/1/21 after pare |
Dividend: Quarterly at $.36 per share (regular only)
TPVG Dividend History | Nasdaq
I have turned off dividend reinvestment.
Yield at AC = 23.15%
Next Ex-Dividend: 6/15/21
Last Substantive Buy Discussion: Item # 3.B. Added 5 TPVG at $11.1; 5 at $10.7; 5 at $8.2; 5 at $6.92; 2 at $5.35; 2 at $4.45; 2 at $4; 2 at $3.5; 2 at $2.99; 5 at $4.96 (4/11/2020 Post)
I have nothing to add to my recent discussion. Item # 1.L. Sold 5 TPVG at $15.67 in Schwab Taxable and Item #1.M. Sold 11 TPVG at $15.67-highest cost shares in Fidelity Taxable(5/16/21 Post)
I own a few shares in Roth IRA accounts and 13 shares in my Vanguard taxable account with an average cost of $5.32 per share (yield at AC = 27.07%):

Disclaimer: I am not a financial advisor but simply an individual investor who has been managing my own money since I was a teenager. In this post, I am acting solely as a financial journalist focusing on my own investments. The information contained in this post is not intended to be a complete description or summary of all available data relevant to making an investment decision. Instead, I am merely expressing some of the reasons underlying the purchase or sale of securities. Nothing in this post is intended to constitute investment or legal advice or a recommendation to buy or to sell. All investors need to perform their own due diligence before making any financial decision which requires at a minimum reading original source material available at the SEC and elsewhere. A failure to perform due diligence only increases what I call "error creep". Stocks, Bonds & Politics: ERROR CREEP and the INVESTING PROCESS Each investor needs to assess a potential investment taking into account their personal risk tolerances, goals, and situational risks. I can only make that kind of assessment for myself and my family members.


